
YouTube Shorts Analytics: The Metrics That Matter (2026)
YouTube Shorts analytics explained: the 5 metrics that decide reach, what viewed vs swiped away tells you, and how to fix a dead Short. Updated for 2026.
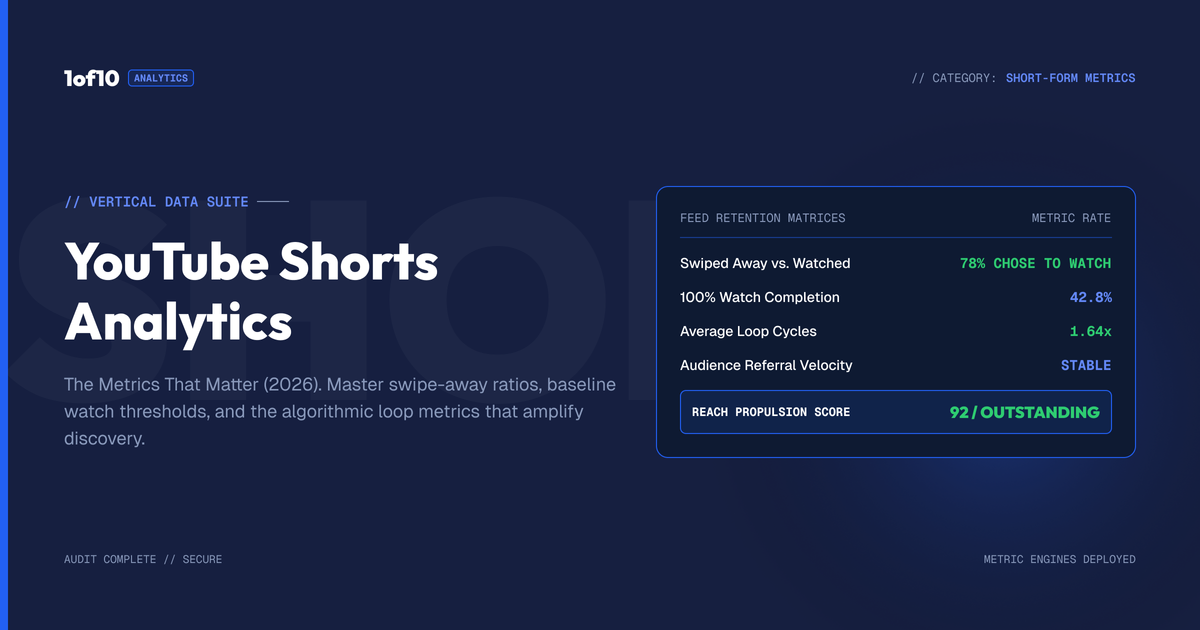
YouTube Shorts analytics live in the Content tab of YouTube Studio, filtered by the Shorts chip. Five numbers decide everything: shown in feed, viewed vs swiped away, engaged views, average view duration, and subscribers gained. Viewed vs swiped away is the one that matters most. It tells you whether your first 2 seconds earn the watch or lose it.
Most creators stare at the wrong number. Total views feel good, but since March 31, 2025 a Shorts view counts the moment your Short starts playing, with no minimum watch time. That means raw views measure distribution, not quality. This guide covers where every Shorts metric lives, what each one actually measures, what good numbers look like, and a step-by-step way to diagnose a Short that died.
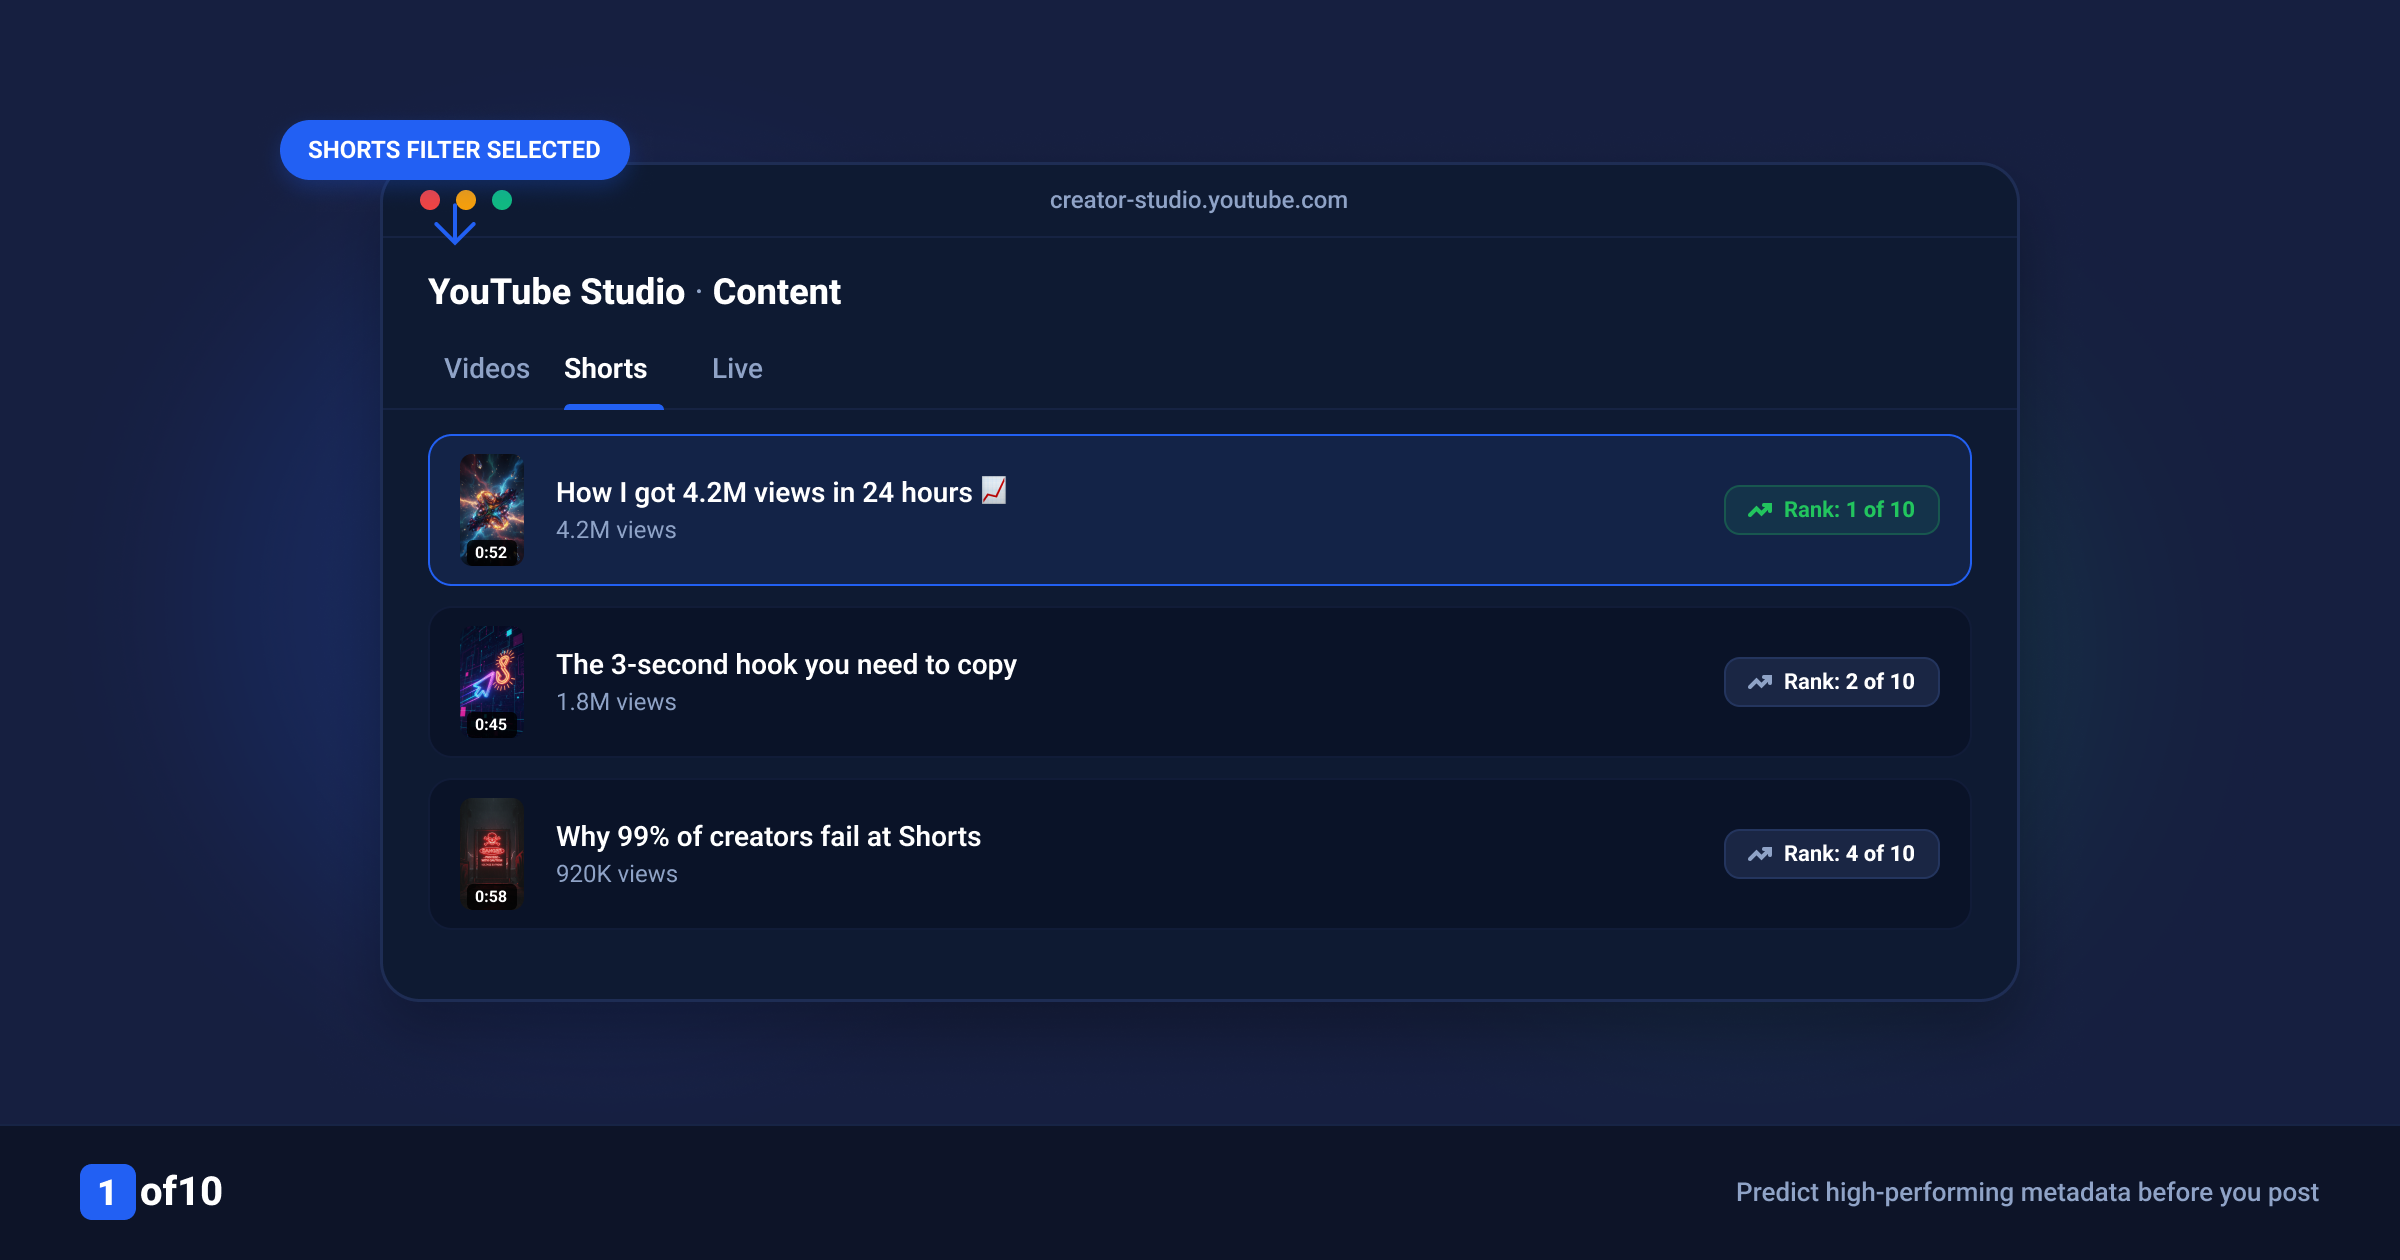
Where to Find YouTube Shorts Analytics in YouTube Studio
YouTube Shorts analytics sit inside YouTube Studio under Analytics, then the Content tab. Select the Shorts chip at the top and Studio switches every card to Shorts-specific data: shown in feed, viewed vs swiped away, engaged views, likes, subscribers, and top remixed content. Per-video analytics open from each Short's thumbnail in the Content list.
Here is the exact path:
- Open YouTube Studio and click Analytics in the left menu.
- Click the Content tab.
- Select the Shorts chip. Long-form, Shorts, live, and posts each get their own filtered view.
- For one specific Short, go to Content in the left menu, hover the Short, and click the Analytics icon.
- For deeper cuts, open Advanced Mode (top right). This is where engaged views live after the 2025 views change.
Two things trip people up. First, the overview cards blend all formats by default, so a channel that posts both formats sees muddy numbers until the Shorts chip is selected. Second, some Shorts-specific cards only appear once a Short has enough feed traffic, so a brand new Short may show sparse data for the first hours.
YouTube's own Content tab tips for Shorts confirm the metric set: views, likes, subscribers, shown in feed, and how many chose to view.
The 5 Shorts Metrics That Actually Matter
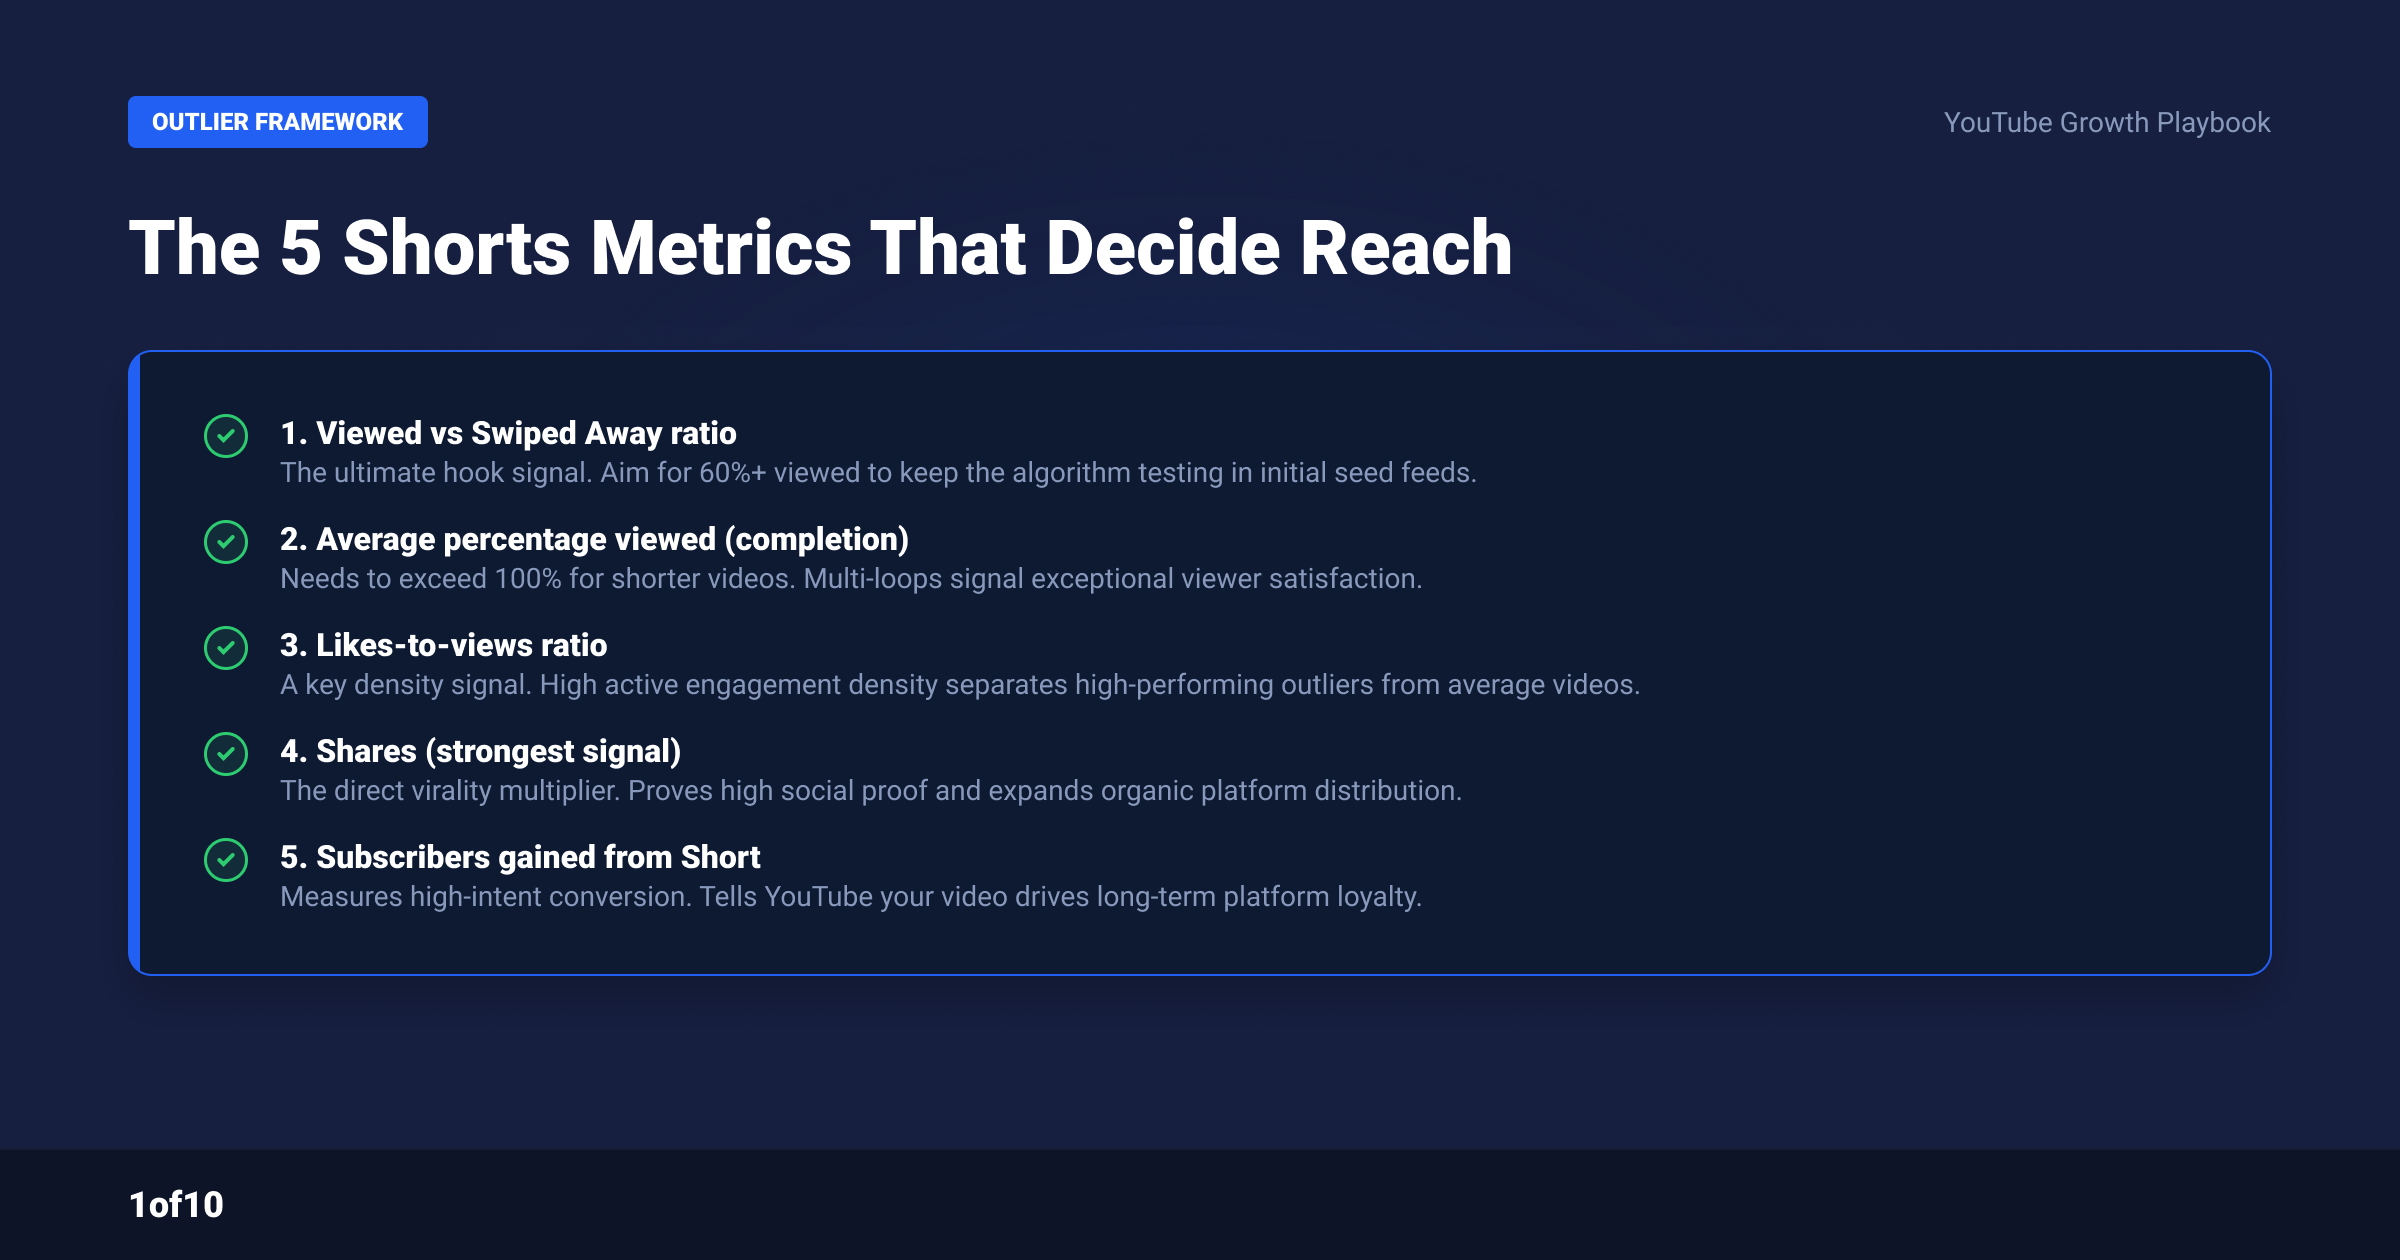
Five metrics explain nearly every Shorts outcome: shown in feed (distribution), viewed vs swiped away (hook strength), engaged views (real watches), average view duration and retention (payoff quality), and subscribers gained (audience conversion). Everything else, including raw view count, is downstream of these five. Learn to read them in that order.
1. Shown in feed
This is the number of times YouTube surfaced your Short in the Shorts feed. It is the Shorts equivalent of impressions, and it measures one thing: how much distribution the algorithm is giving you. A Short cannot get views it was never shown for. When this number is low, the problem is upstream of your content quality. When it is high and views are still low, the problem is your hook.
2. Viewed vs swiped away: THE metric
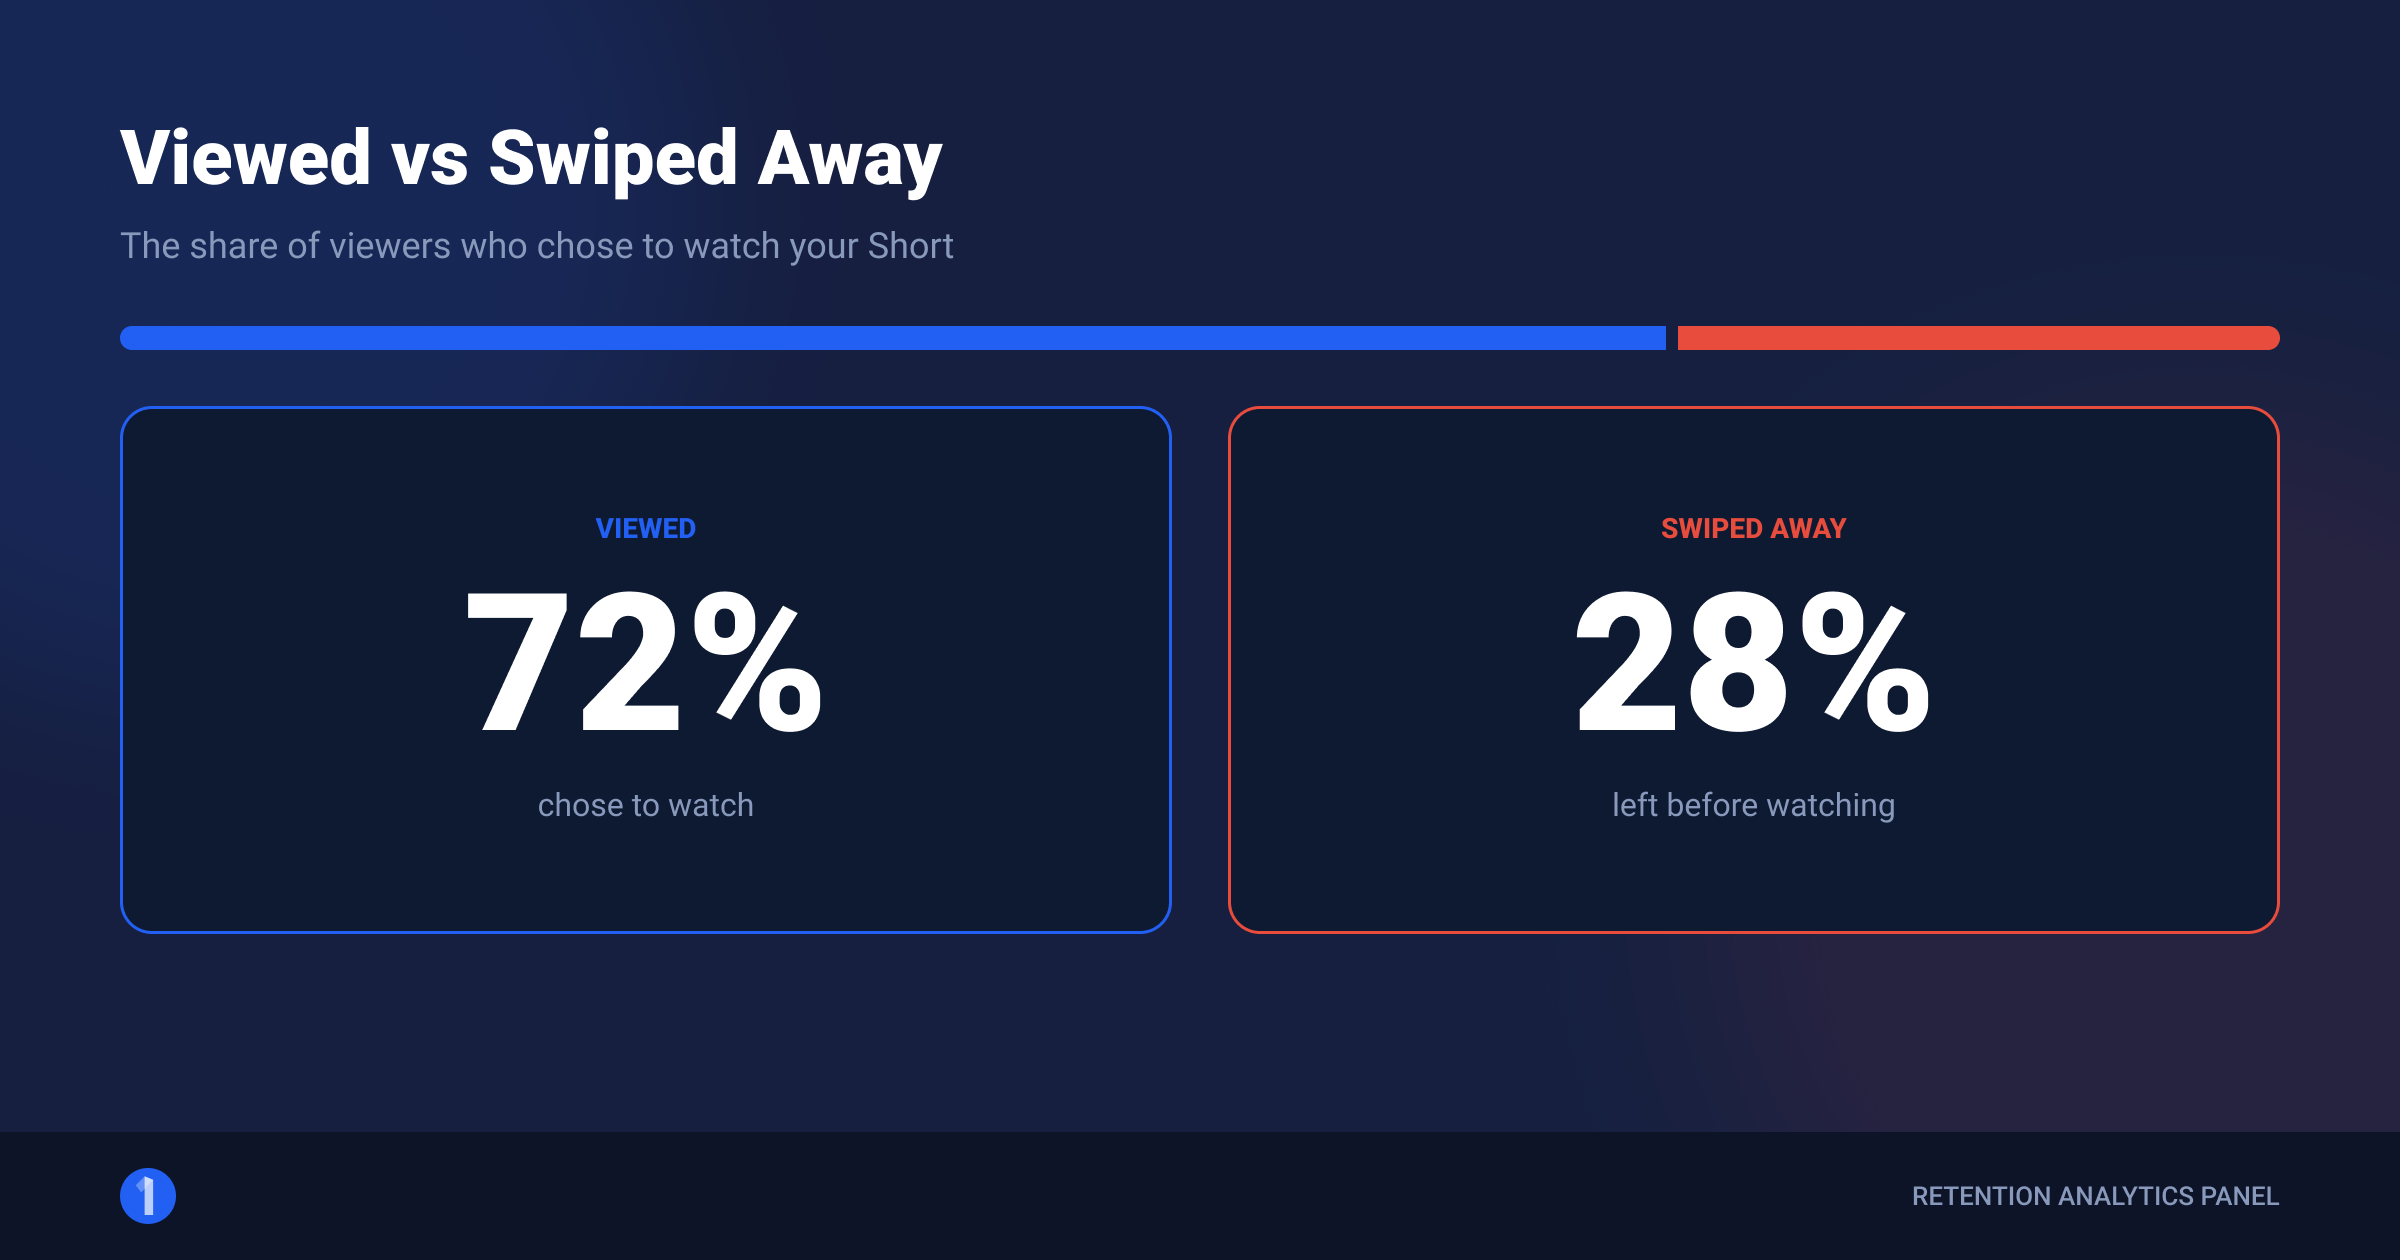
YouTube Studio reports this as "how many chose to view," and it is the percentage of feed appearances where the viewer stayed instead of swiping past. This is the single strongest signal you control. The Shorts feed is an autoplay environment. Nobody clicks a thumbnail. The viewer's only decision is stay or swipe, and they make it in roughly the first 1 to 2 seconds.
Treat viewed vs swiped away as your hook score. If it is weak, nothing downstream can save the Short, because YouTube throttles distribution to viewers who keep swiping away.
3. Engaged views
On March 31, 2025 YouTube changed how Shorts views are counted. A view now registers the instant a Short starts to play or replay, with no minimum watch time. The old, stricter metric still exists and is called engaged views. You will find it in Advanced Mode in YouTube Analytics.
Engaged views matter more than views for two hard reasons:
- YouTube Partner Program eligibility for the Shorts path is based on engaged views, not raw views.
- Shorts ad revenue sharing is calculated from engaged views, not raw views.
When the change rolled out, most channels saw raw Shorts views jump 20 to 30 percent overnight with zero change in reach or earnings. If you compare pre-2025 numbers to current ones, compare engaged views to old views, not new views to old views. YouTube announced the change in an official community post.
4. Average view duration and retention
For a Short, average percentage viewed is the honest quality score. A 30-second Short watched for 27 seconds averages 90 percent. Shorts can exceed 100 percent when viewers loop, and looping is one of the strongest positive signals a Short can send, because a rewatch means the ending fed back into the beginning.
Read the retention graph for the shape, not just the average:
- A cliff in the first 2 seconds means the hook failed.
- A steady slide means pacing drags, usually dead frames or slow talking.
- A mid-video drop means you promised something the middle did not deliver.
- A tail that climbs past 100 percent means the loop works. Make more like it.
5. Subscribers gained
Shorts reach is rented. Subscribers are owned. This card shows the net subscriber change each Short produced, and it separates Shorts that entertain strangers from Shorts that build a channel. A Short with 500,000 views and 40 subscribers went wide and converted nobody. A Short with 80,000 views and 900 subscribers found your actual audience. When you decide which formats to repeat, weigh this number heavily.
What Counts as a Shorts View Now?
Since March 31, 2025, a Shorts view is counted every time your Short starts to play or replay, with no minimum watch time. The previous definition, which required the viewer to choose to keep watching, was renamed engaged views and moved to Advanced Mode. Views measure exposure. Engaged views measure attention. Monetization and YPP eligibility run on engaged views.
Practical translation for your dashboard:
- Use views to judge distribution and topic reach.
- Use engaged views to judge content quality and to project revenue.
- Never mix the two in a before and after comparison across March 2025.
What Do Good Shorts Numbers Look Like?
YouTube publishes no official benchmarks for viewed vs swiped away, retention, or any other Shorts metric. Any table of targets you see, including this one, comes from creator-reported data, not from YouTube. Use these community-observed ranges as rough orientation, then beat your own channel averages, which Studio shows you next to every metric.
| Metric | Community-observed "working" range | Community-observed "strong" range |
|---|---|---|
| Viewed vs swiped away | 70 to 79 percent | 80 percent and above |
| Average percentage viewed (under 35s) | 80 to 90 percent | 90 percent and above, looping past 100 |
| Average percentage viewed (60s+) | 60 to 75 percent | 75 percent and above |
| Likes per view | 3 to 5 percent | 5 percent and above |
Three honest caveats:
- These ranges are not official. They are patterns creators report, and they shift by niche. Label them as direction, not law.
- Studio's built-in comparison, "compared to your typical performance," is more useful than any external benchmark, because the algorithm judges you against your own baseline first.
- Longer Shorts naturally post lower percentage retention. A 75 percent average on a 3-minute Short is a better result than 85 percent on a 15-second Short.
The First 2 Seconds Problem
Shorts live or die in the first 2 seconds. That is the swipe decision window, and it is why viewed vs swiped away is the master metric. In long-form, the thumbnail and title do the selling before playback starts. In Shorts, frame one is the thumbnail, the hook, and the promise all at once.
What the first 2 seconds must do:
- Show motion or change immediately. A static talking head with a slow "hey guys" is a swipe. Cold-open into the action.
- State or show the payoff. The viewer should know within one breath what they will get if they stay.
- Open a loop. A question, an unfinished action, or a visible countdown gives the brain a reason to wait.
- Cut the logo, cut the intro, cut the context. Context can come at second 5. It cannot come at second 1.
The same psychology drives long-form openings, and our guide on hooking viewers in the first 30 seconds breaks down hook structures that transfer directly to Shorts, just compressed 15x.
If your viewed vs swiped away is under your channel's typical performance, do not touch the middle of your Shorts. Reshoot the first 2 seconds and repost the concept. That one edit moves the metric more than anything else you can do.
Shorts vs Long-Form Analytics: What Changes
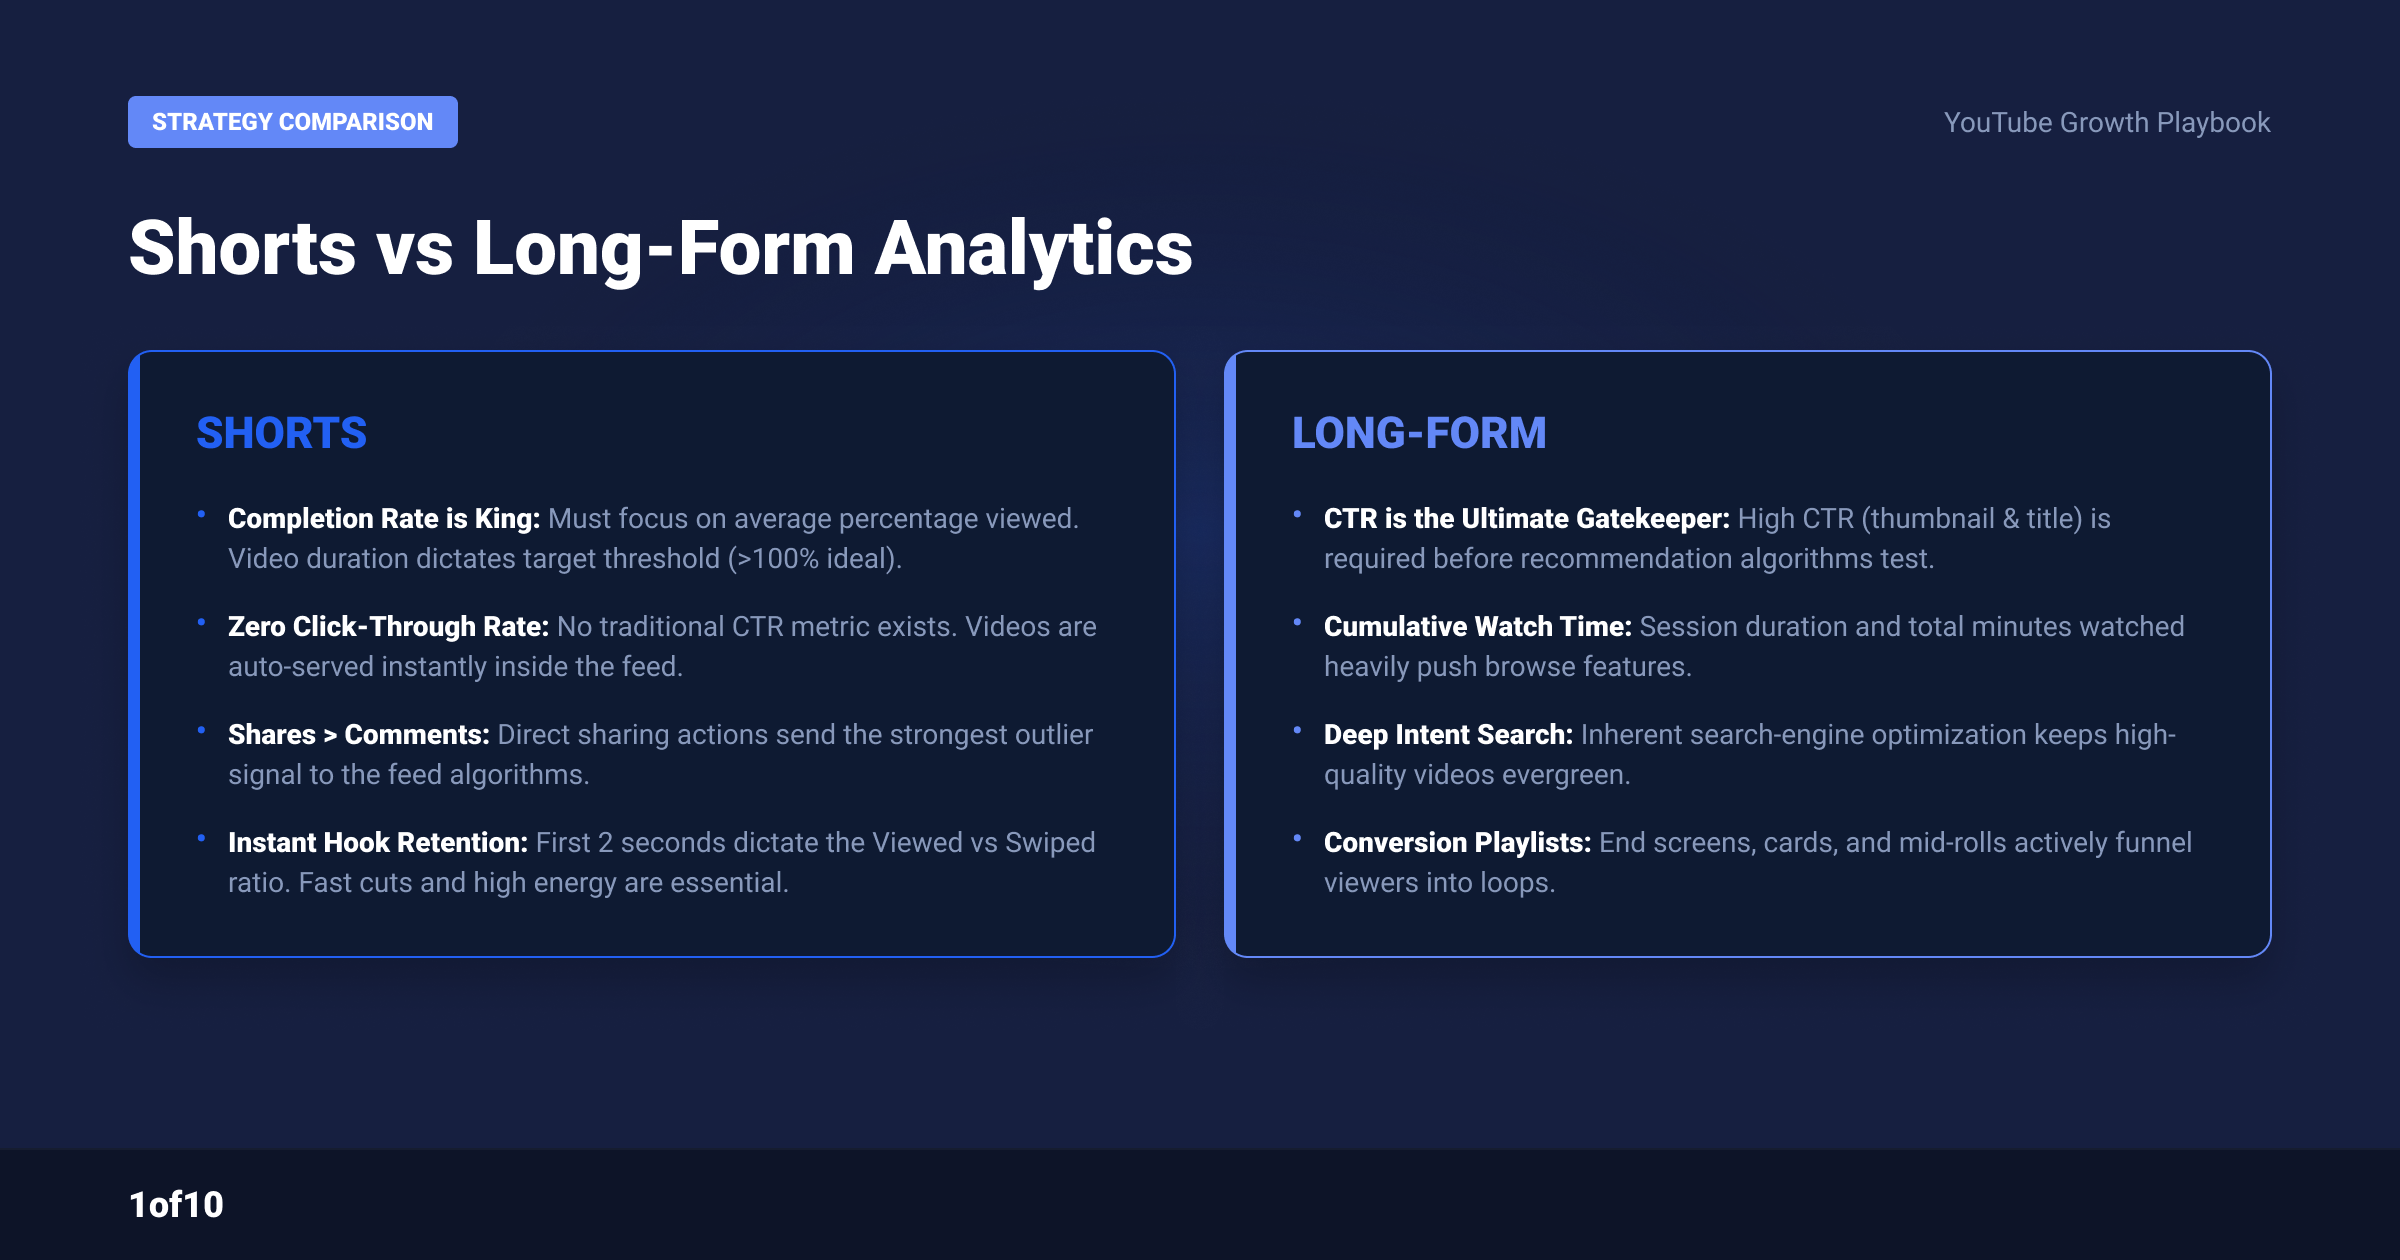
Shorts analytics and long-form analytics measure different games. Long-form is a click economy: impressions, CTR, then watch time. Shorts is a swipe economy: feed appearances, stay-or-swipe, then loops. The metrics rename accordingly, and CTR, the king of long-form, barely matters for Shorts because feed viewers never see a thumbnail before playback.
| Long-form metric | Shorts equivalent | What changed |
|---|---|---|
| Impressions | Shown in feed | Same idea, different surface |
| Thumbnail CTR | Viewed vs swiped away | Click decision becomes a swipe decision |
| Views (30s threshold historically) | Views (any play since Mar 2025) plus engaged views | Split into exposure and attention |
| Average view duration | Average percentage viewed, can pass 100 | Loops count and matter |
| End screens and cards | Related video link | Weaker, but improving |
Why CTR barely matters for Shorts: thumbnails on Shorts only appear on your channel page, in search results, and in a few browse surfaces. The overwhelming majority of Shorts traffic comes from the Shorts feed, where playback starts automatically. Your "CTR" is the viewed vs swiped away rate. If you are used to optimizing packaging for clicks, that instinct still pays, it just moves from the thumbnail to frame one. For long-form, CTR remains decisive, and our breakdown of what a good click-through rate on YouTube looks like covers those numbers.
One more difference: subscriber intent. Shorts viewers are leaned back and swiping. They subscribe less per view than long-form viewers. Plan for Shorts to build reach and recognition, then convert with long-form. How the recommendation system weighs all of this is covered in our guide to how the YouTube algorithm works.
Why Is My Short Dead? A Diagnosis Decision Tree
A dead Short has exactly one of four failure points: no distribution, a failed hook, a broken middle, or a topic ceiling. The metrics tell you which one, in order. Check shown in feed first, then viewed vs swiped away, then the retention graph, then topic demand. Fix the first broken step you find and ignore the rest.
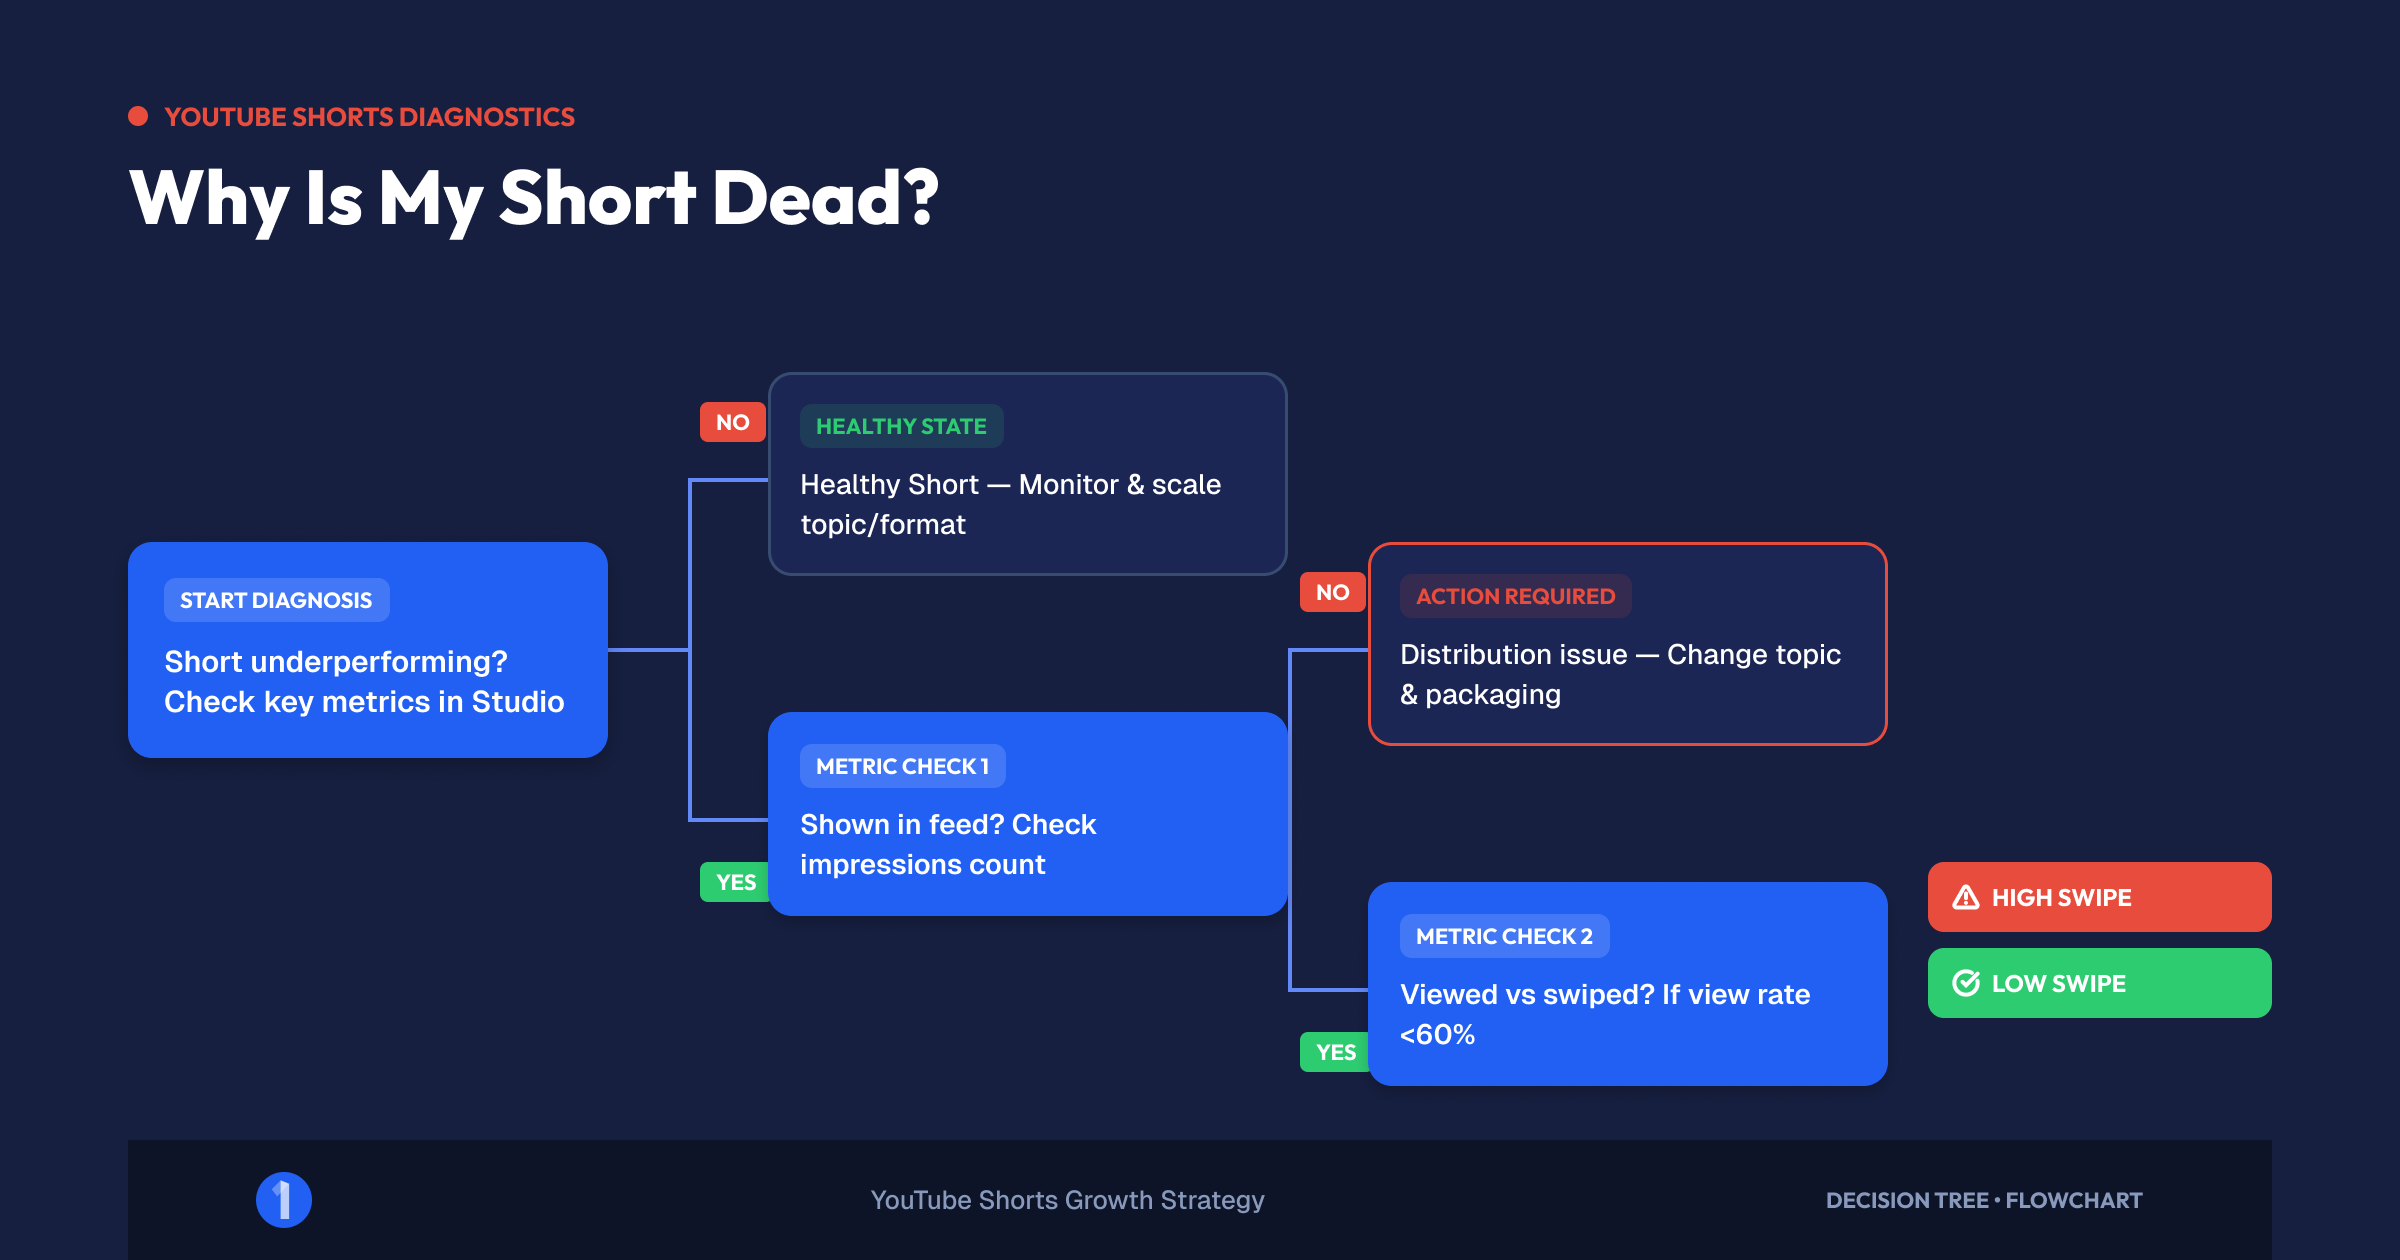
Work down this tree:
- Is shown in feed near zero? YouTube is not distributing the Short. Common causes: the channel has no Shorts history, the topic gives the algorithm no audience signal, or the Short reused content the system has seen. Fix: post consistently in one niche so the feed knows who to test you on, and pick topics with proven demand (next section). Also check for a limited visibility flag in Studio.
- Shown in feed is fine, but viewed vs swiped away is below your typical performance? The hook failed. Fix: reshoot the first 2 seconds. Faster motion, payoff stated up front, no intro.
- People stay past 2 seconds, but retention slides through the middle? Pacing or payoff failed. Fix: cut every dead frame, move the reveal earlier, shorten the Short. Most middles are 20 percent too long.
- Retention is strong and the Short still stalled? You likely hit a topic ceiling. The content works, but the audience for it is small. Fix: keep the format, aim it at a bigger proven topic.
The mistake to avoid: reacting to low views by changing everything. Views are the last number in the chain. Diagnose upstream, change one variable, and repost. For distribution mechanics and feed behavior, our guide on how to go viral on YouTube Shorts goes deeper on step 1.
Find Outlier Shorts in Your Niche Before You Post
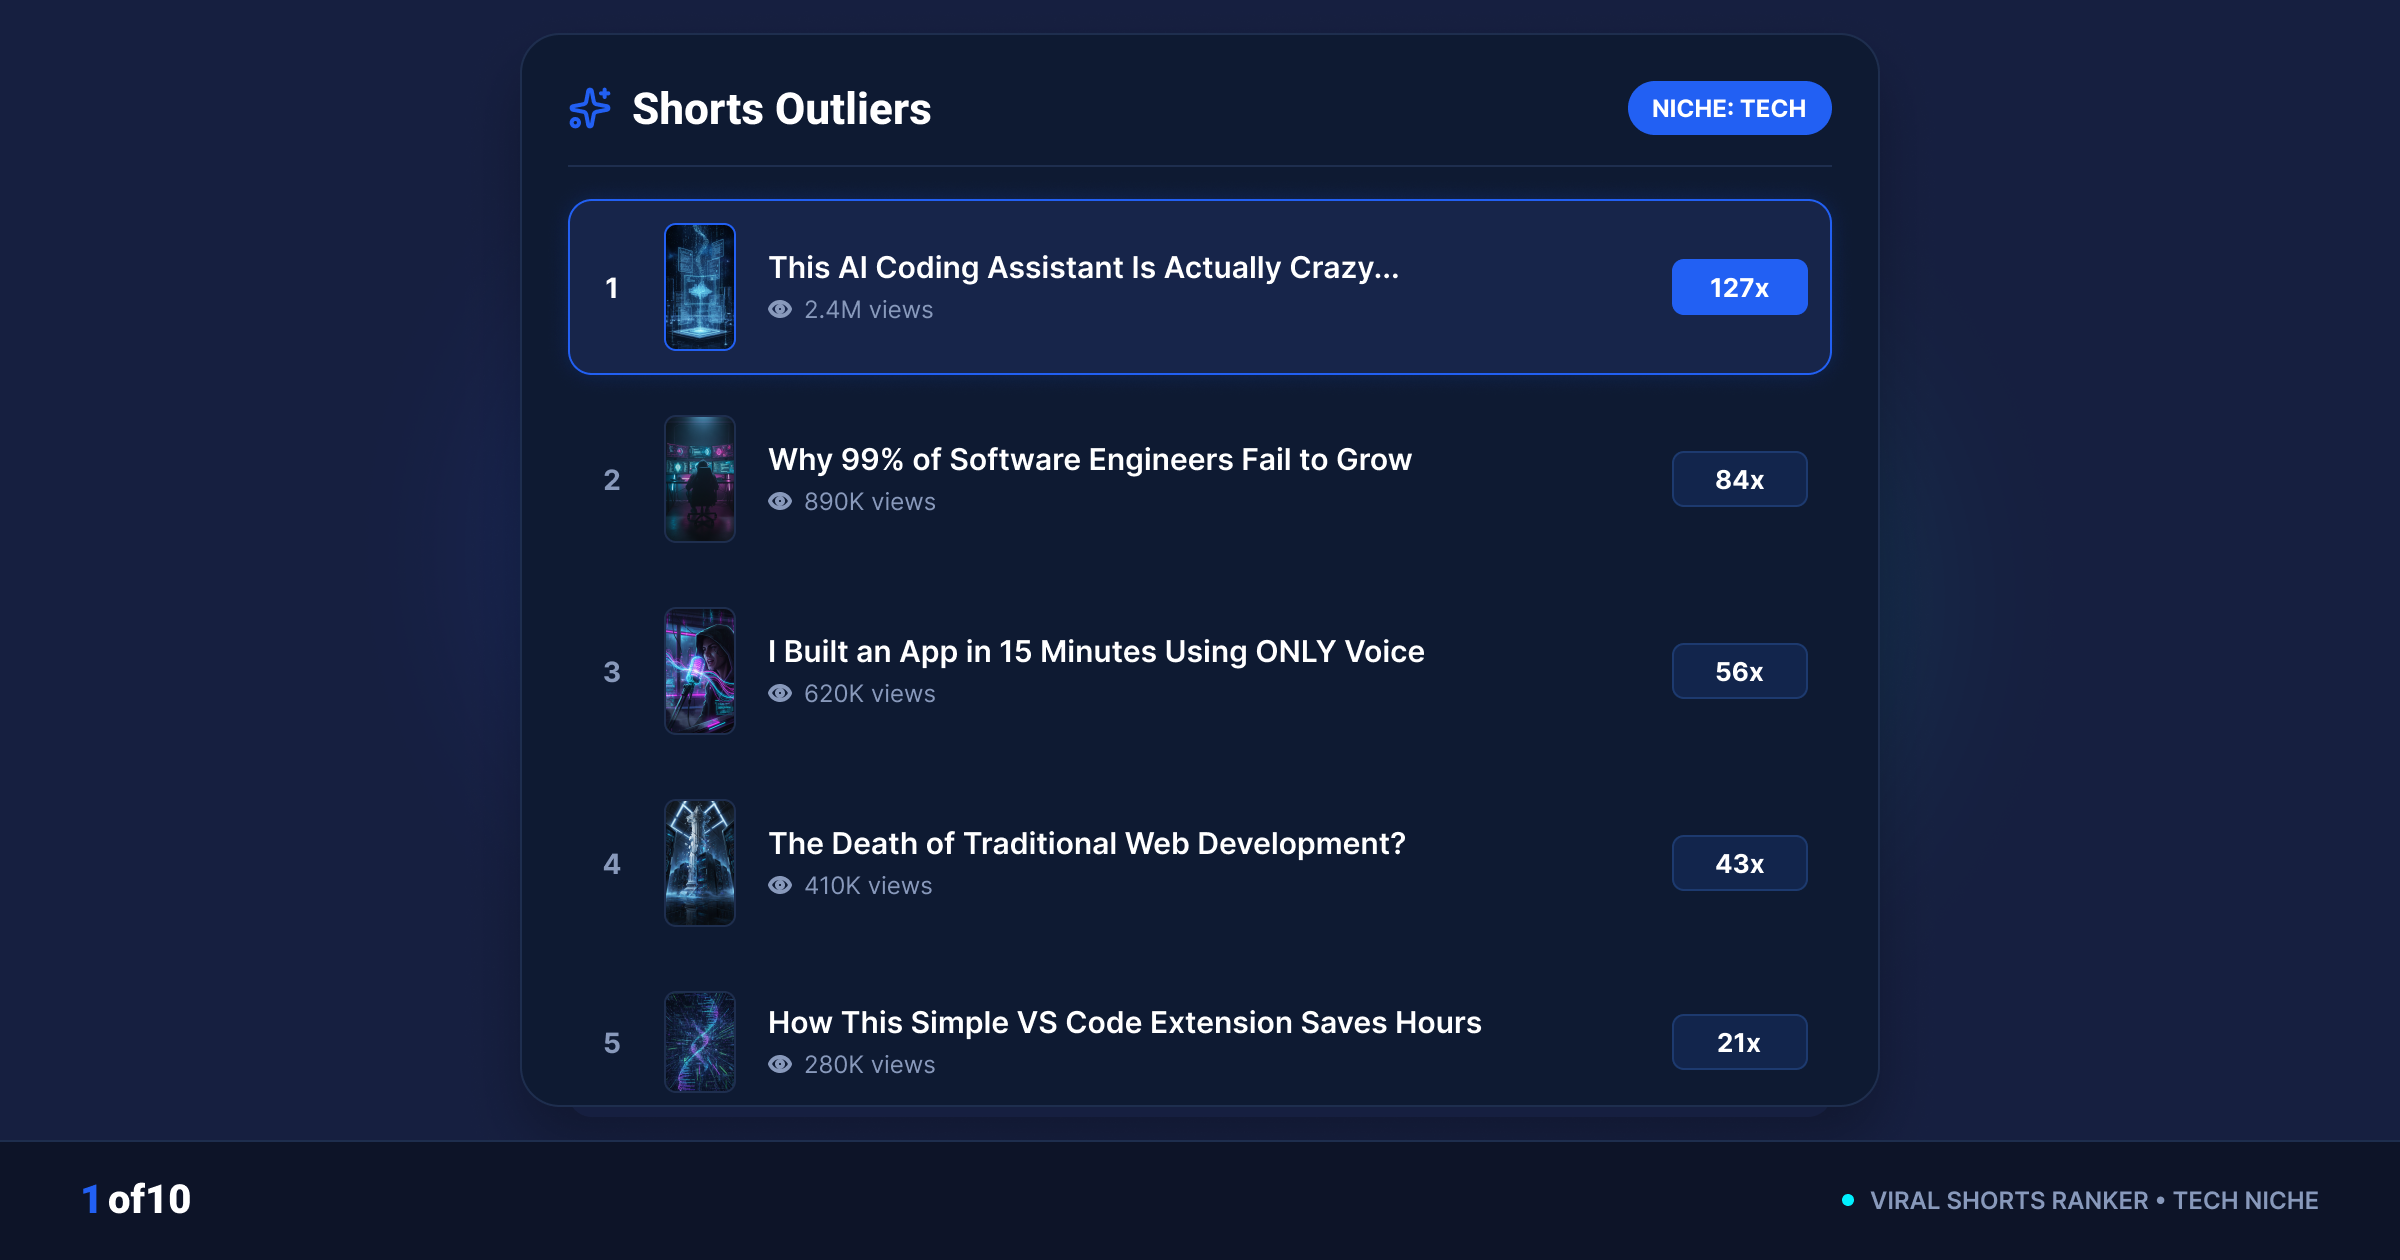
Analytics tell you what happened. Outlier research tells you what to make next. An outlier Short is one performing 10x or more above its channel's average, which strips channel size out of the equation and isolates the idea. Studying 20 to 30 outlier Shorts in your niche shows you which hooks, formats, and topics the feed is rewarding right now.
Shorts Outliers inside 1of10 surfaces these for you: Shorts trending far above channel baseline in your niche, before the format saturates. The workflow:
- Search your niche and sort by outlier score, not raw views. A 40x Short from a 2,000-subscriber channel is a stronger idea signal than 10 million views on a channel with 8 million subscribers.
- Watch the first 2 seconds of every outlier with the sound off. Write down what makes you not swipe.
- Extract the pattern, not the video: hook type, length band, pacing, text placement, payoff timing.
- Map the pattern onto your own topic. Copy structure, never content.
- Post, then read your viewed vs swiped away against the outlier's implied hook strength.
Patterns worth logging from any outlier set: length band (are winners 20s or 90s in this niche), first-frame composition, whether text hooks or spoken hooks dominate, and loop mechanics. There is also a Shorts workflow hack for repurposing what you learn across formats.
Shorts outliers cluster around a 1.3x median multiple, with the top performers clearing 1,000x.
What About the Money?
Analytics and revenue connect through one metric: engaged views. Raw views inflate the dashboard, but YPP eligibility and Shorts revenue sharing both run on engaged views. If monetization is the goal, your analytics priority order stays identical: distribution, hook, retention, because each step multiplies engaged views.
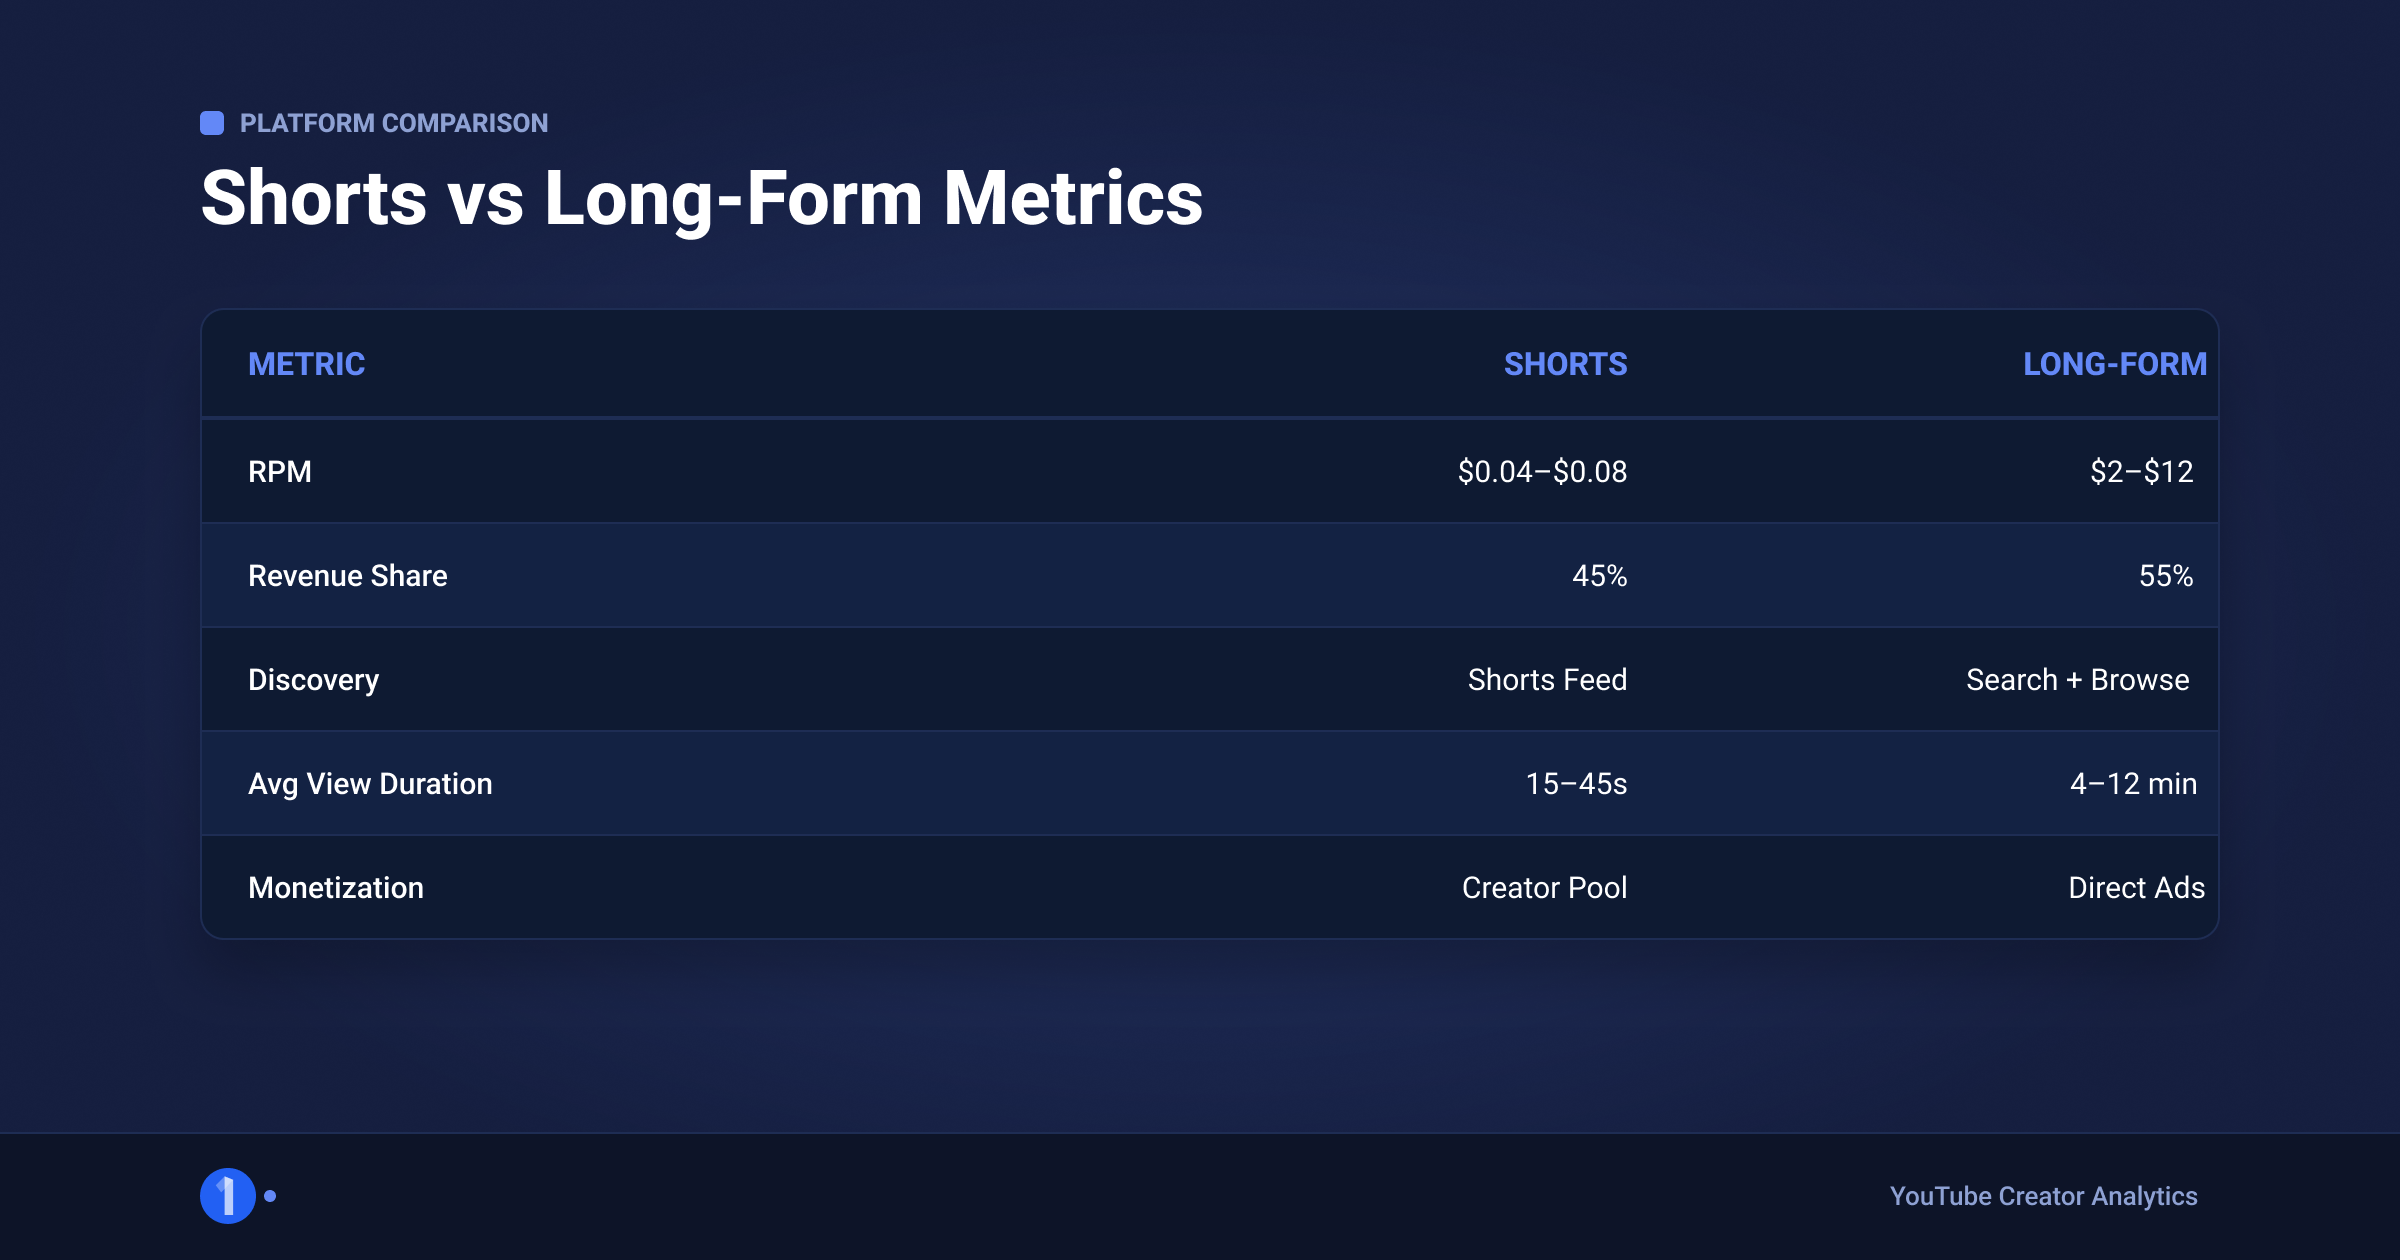
Two guides to go deeper: how to get monetized with YouTube Shorts walks the eligibility path, and how much YouTube pays Shorts creators covers real RPM expectations, which are far below long-form and make engaged view volume the whole game.
FAQ
What is a good swipe-away rate?
YouTube publishes no official benchmark. Community-reported numbers suggest 70 percent or more choosing to view (30 percent or less swiping away) is workable, and 80 percent viewed or better is strong. The more reliable target is your own baseline: Studio shows each Short against your typical performance, and beating that is what earns more distribution.
Why are my Shorts getting no views?
Check shown in feed first. If it is near zero, YouTube is not distributing you: post consistently in one niche, pick topics with proven demand, and check for visibility restrictions in Studio. If feed numbers are fine but views are low, your viewed vs swiped away is failing, which means the first 2 seconds need a reshoot.
What is the difference between views and engaged views?
Since March 31, 2025, a view counts the instant a Short plays or replays, with no minimum watch time. An engaged view uses the old, stricter standard where the viewer chooses to keep watching. Engaged views live in Advanced Mode, and they are what count for YouTube Partner Program eligibility and Shorts revenue sharing.
Where do I find viewed vs swiped away in YouTube Studio?
Open YouTube Studio, go to Analytics, select the Content tab, and click the Shorts chip. The card labeled "how many chose to view" shows the percentage of feed appearances where viewers watched instead of swiping. Per-Short numbers are in each video's individual analytics under the Reach section.
Do Shorts analytics affect my long-form videos?
Not directly. YouTube evaluates Shorts and long-form on separate surfaces with separate signals, and a weak Short does not drag down your videos. Indirectly, Shorts feed your channel: they add subscribers, and viewers who subscribe from Shorts see your long-form uploads. Track subscribers gained per Short to measure that handoff.