
What Actually Makes a YouTube Video Go Viral in 2025
Insights from 62+ Billion Views, 300,000 Videos, and 52,000 Channels
Every creator asks the same question:
“Why did that video go viral?”
Most answers are vague:
- “The algorithm liked it”
- “Good retention”
- “It just worked”
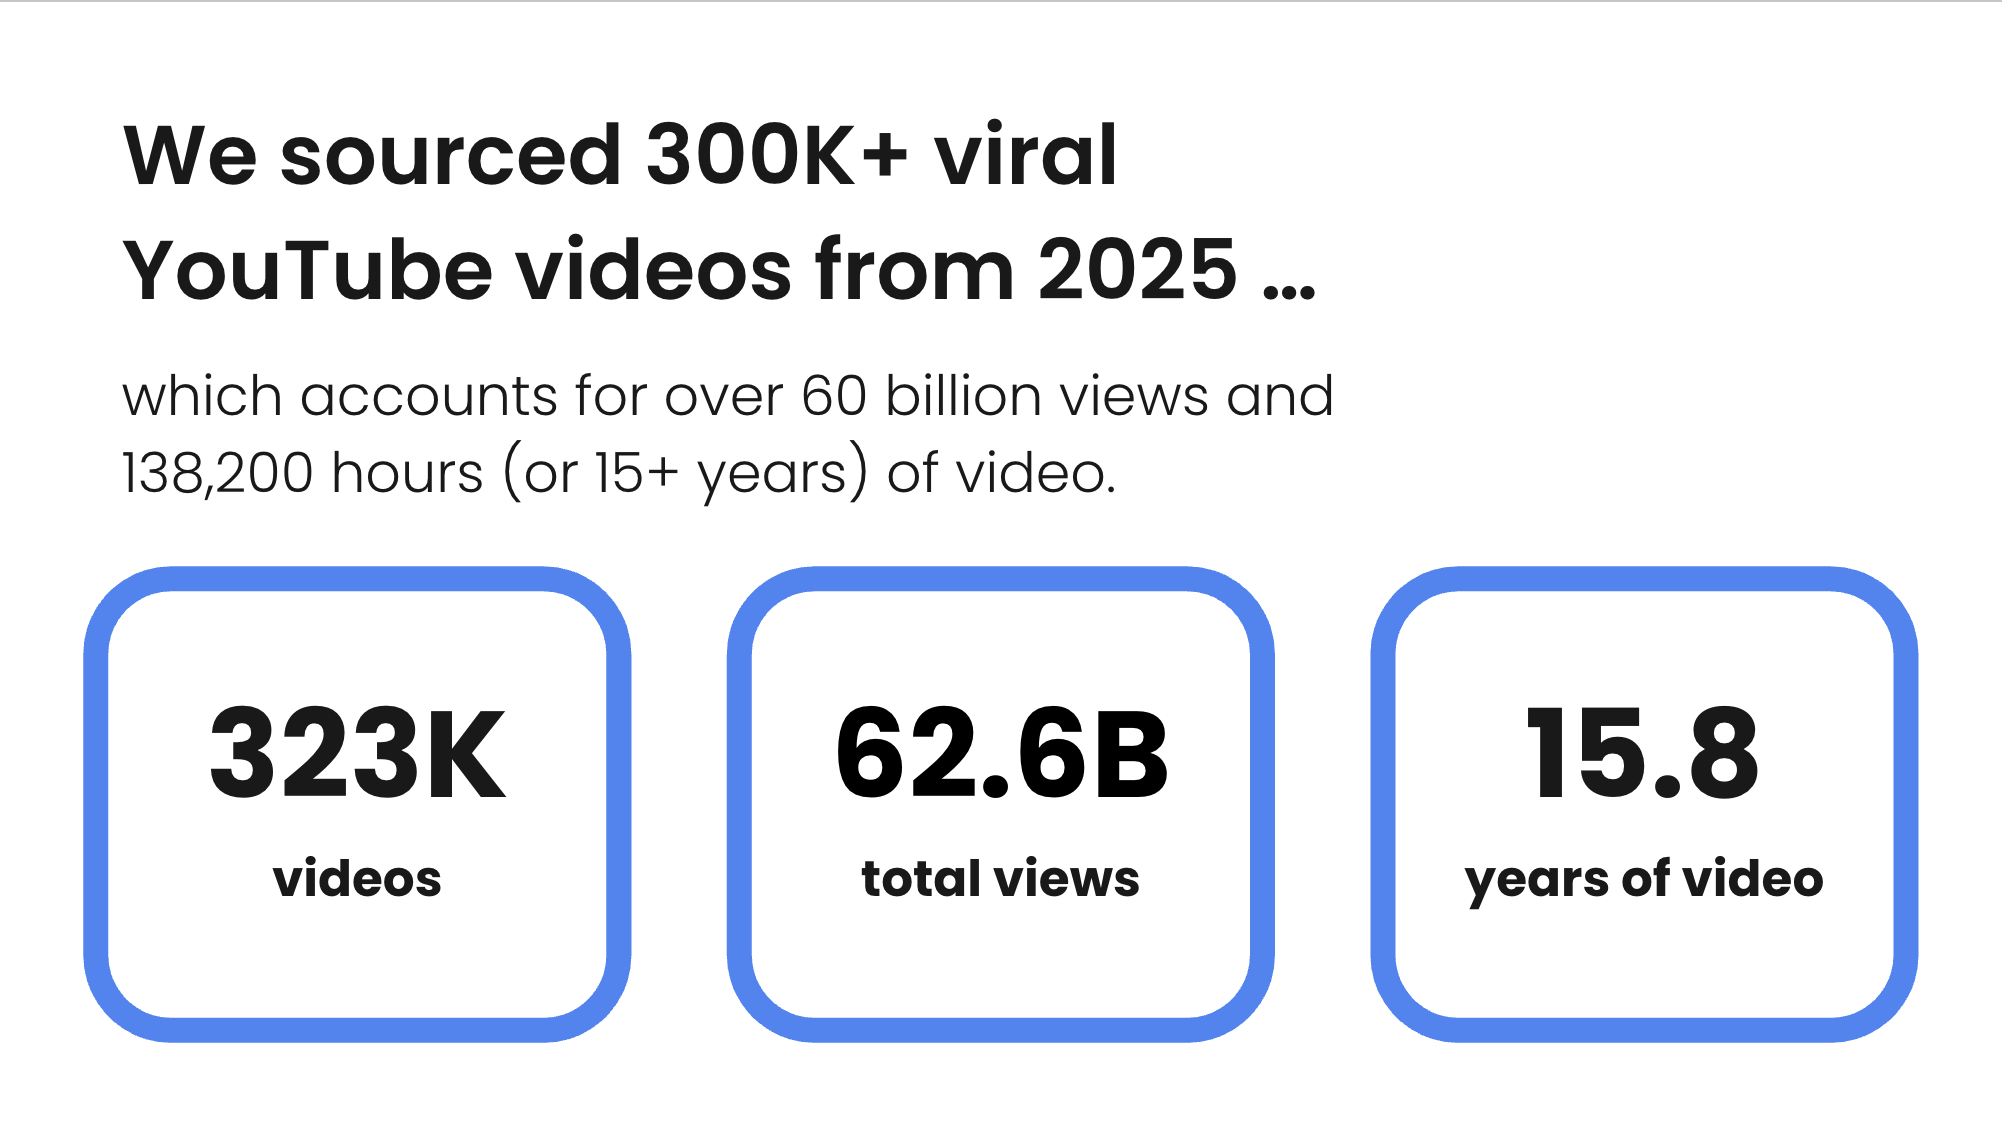
So instead of guessing, we ran the largest exploratory study we’ve ever done on YouTube performance.
From 300,000+ high-performing videos published in 2025, totaling 62.6 billion views and 15+ years of watch time, we analyzed hundreds of variables across:
- Titles
- Thumbnails
- Video length
- Emotion
- Sentiment
- Niche
- Channel size
- Visual composition
This report breaks down what actually correlates with viral performance, and more importantly, why.
Viral Strategy: Understanding the Outlier Score (This part matters)
Most studies compare:
viral videos vs other viral videos
That’s useless.
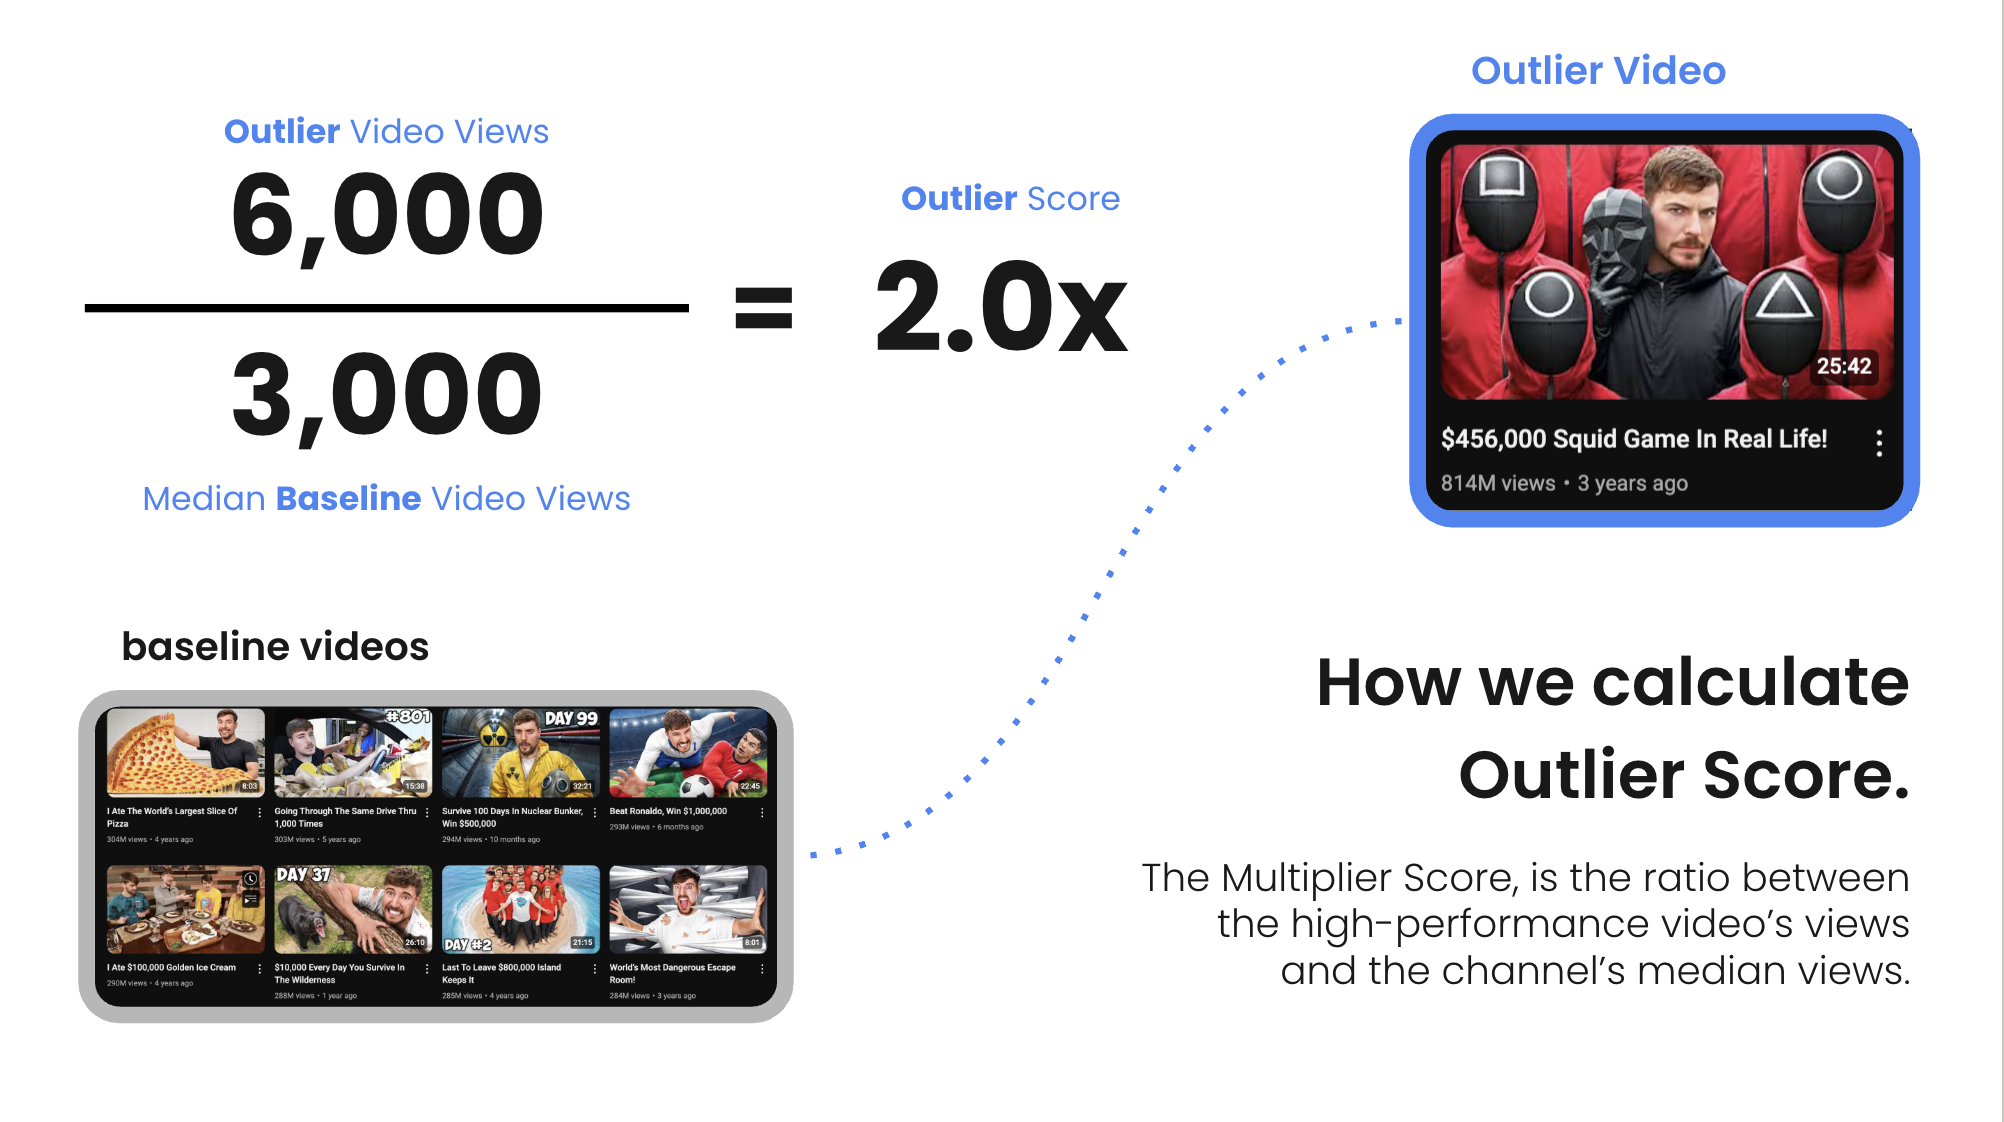
Instead, we used an Outlier Score, defined as:
Outlier Score = Video Views ÷ Channel’s Median Views
This lets us isolate:
- Videos that significantly outperform a channel’s normal baseline
- Regardless of channel size
A 50K-sub channel hitting 1M views matters just as much as a 10M-sub channel hitting 20M.
This is how you learn repeatable strategy, not bias.

1) Best YouTube Video Length for 2026
What creators upload vs what performs
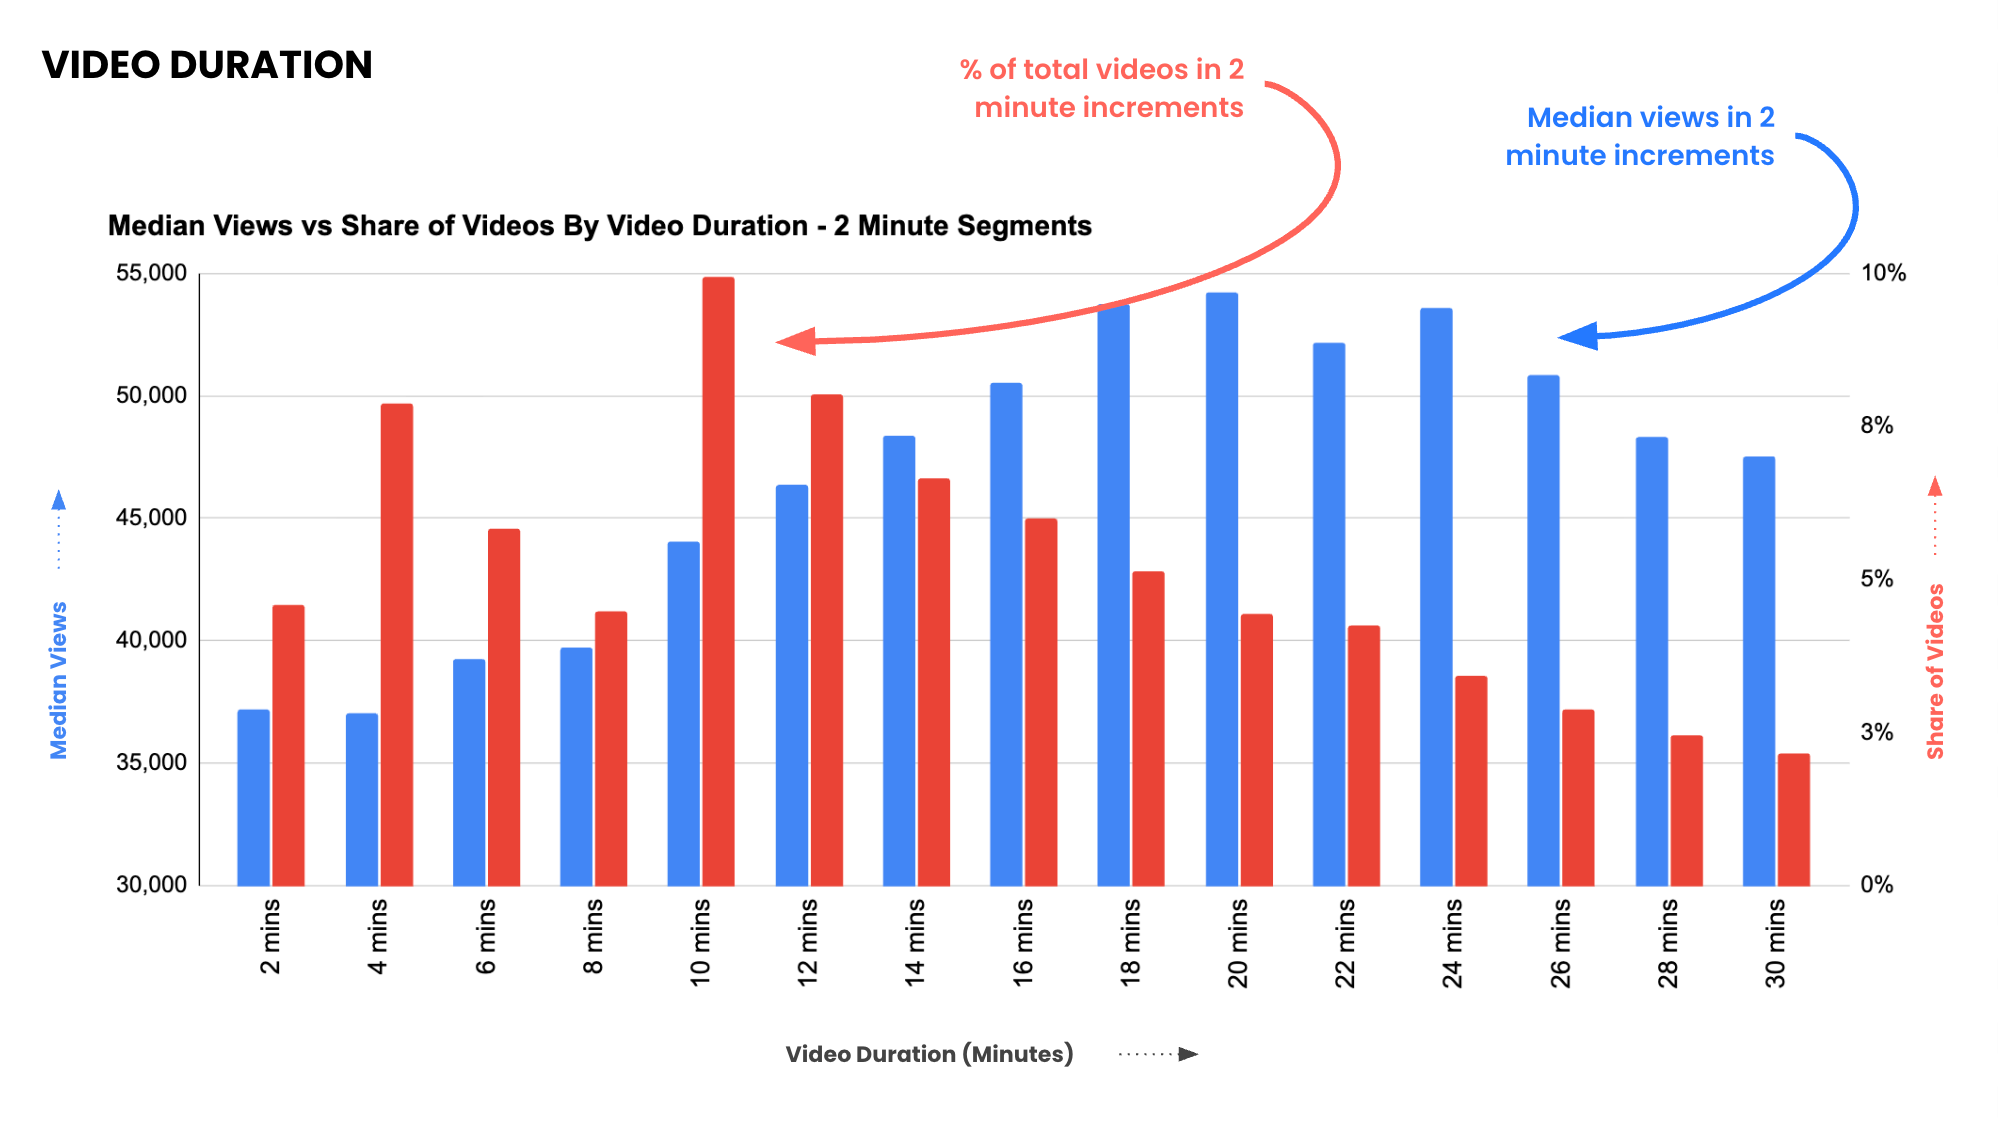
Over 52% of all videos under 30 minutes are shorter than 12 minutes.
Creators overwhelmingly prefer:
- 4 minutes
- 8 minutes
- 10 minutes
But when we plotted median views by video duration, a very different pattern emerged.
The core finding
For videos under 30 minutes:
- Median views steadily increase as videos get longer
- Performance peaks between 18–24 minutes
- After ~24 minutes, performance slowly declines
Short videos are easier to produce.
Longer videos are easier to scale.
Why longer videos win
Longer videos:
- Accumulate more total watch time
- Give YouTube more data to classify viewer satisfaction
- Increase session duration
- Allow more emotional and narrative buildup
YouTube does not reward shortness.
It rewards sustained attention.
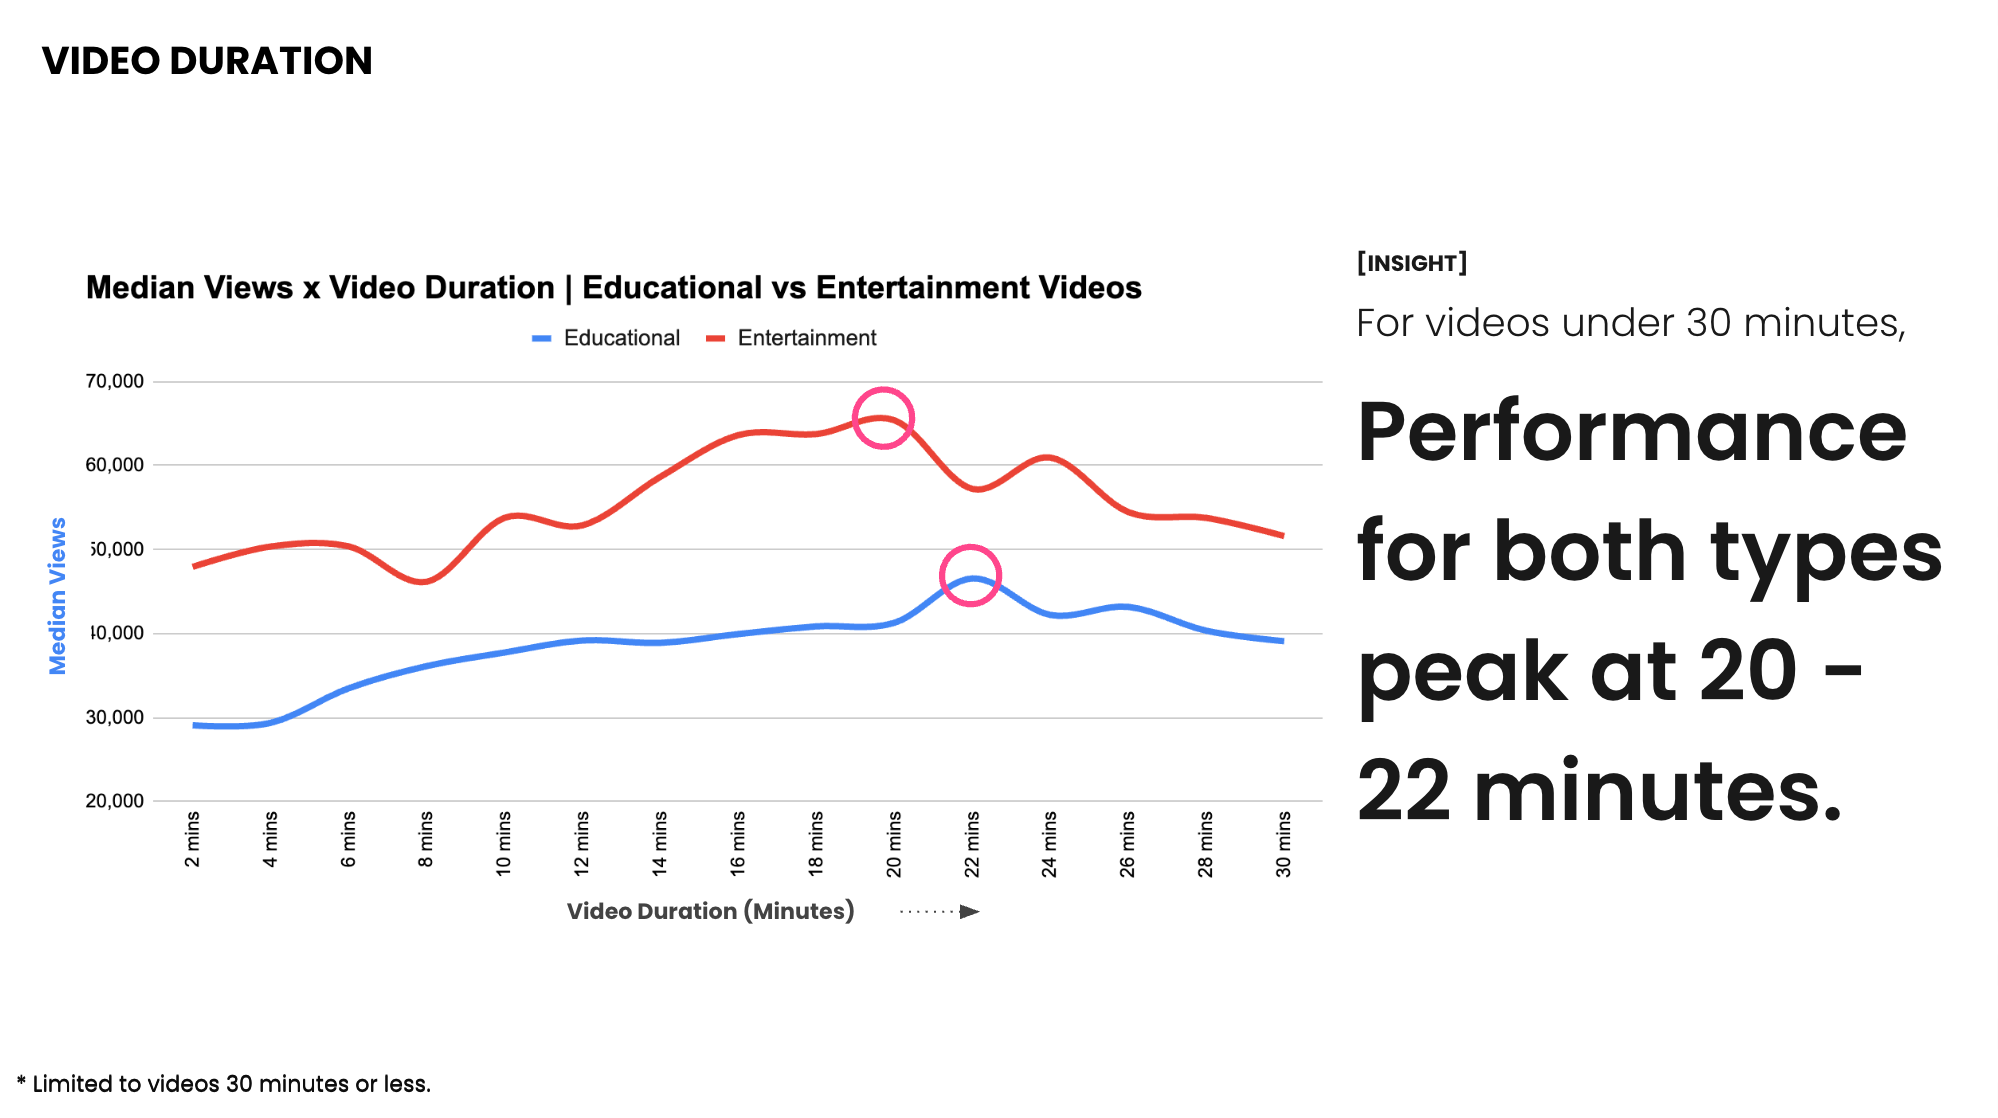
Educational vs Entertainment Length
Creators upload educational and entertainment videos at similar lengths.
But performance tells a different story.
Performance peaks:
- Entertainment: ~20 minutes
- Educational: ~20–22 minutes
Despite this:
- Creators still cluster around 4 and 10 minutes
Insight:
Creators optimize for production comfort, not algorithmic upside.
2) Writing YouTube Titles That Get Clicks
Titles are not SEO containers.
They are decision accelerators.
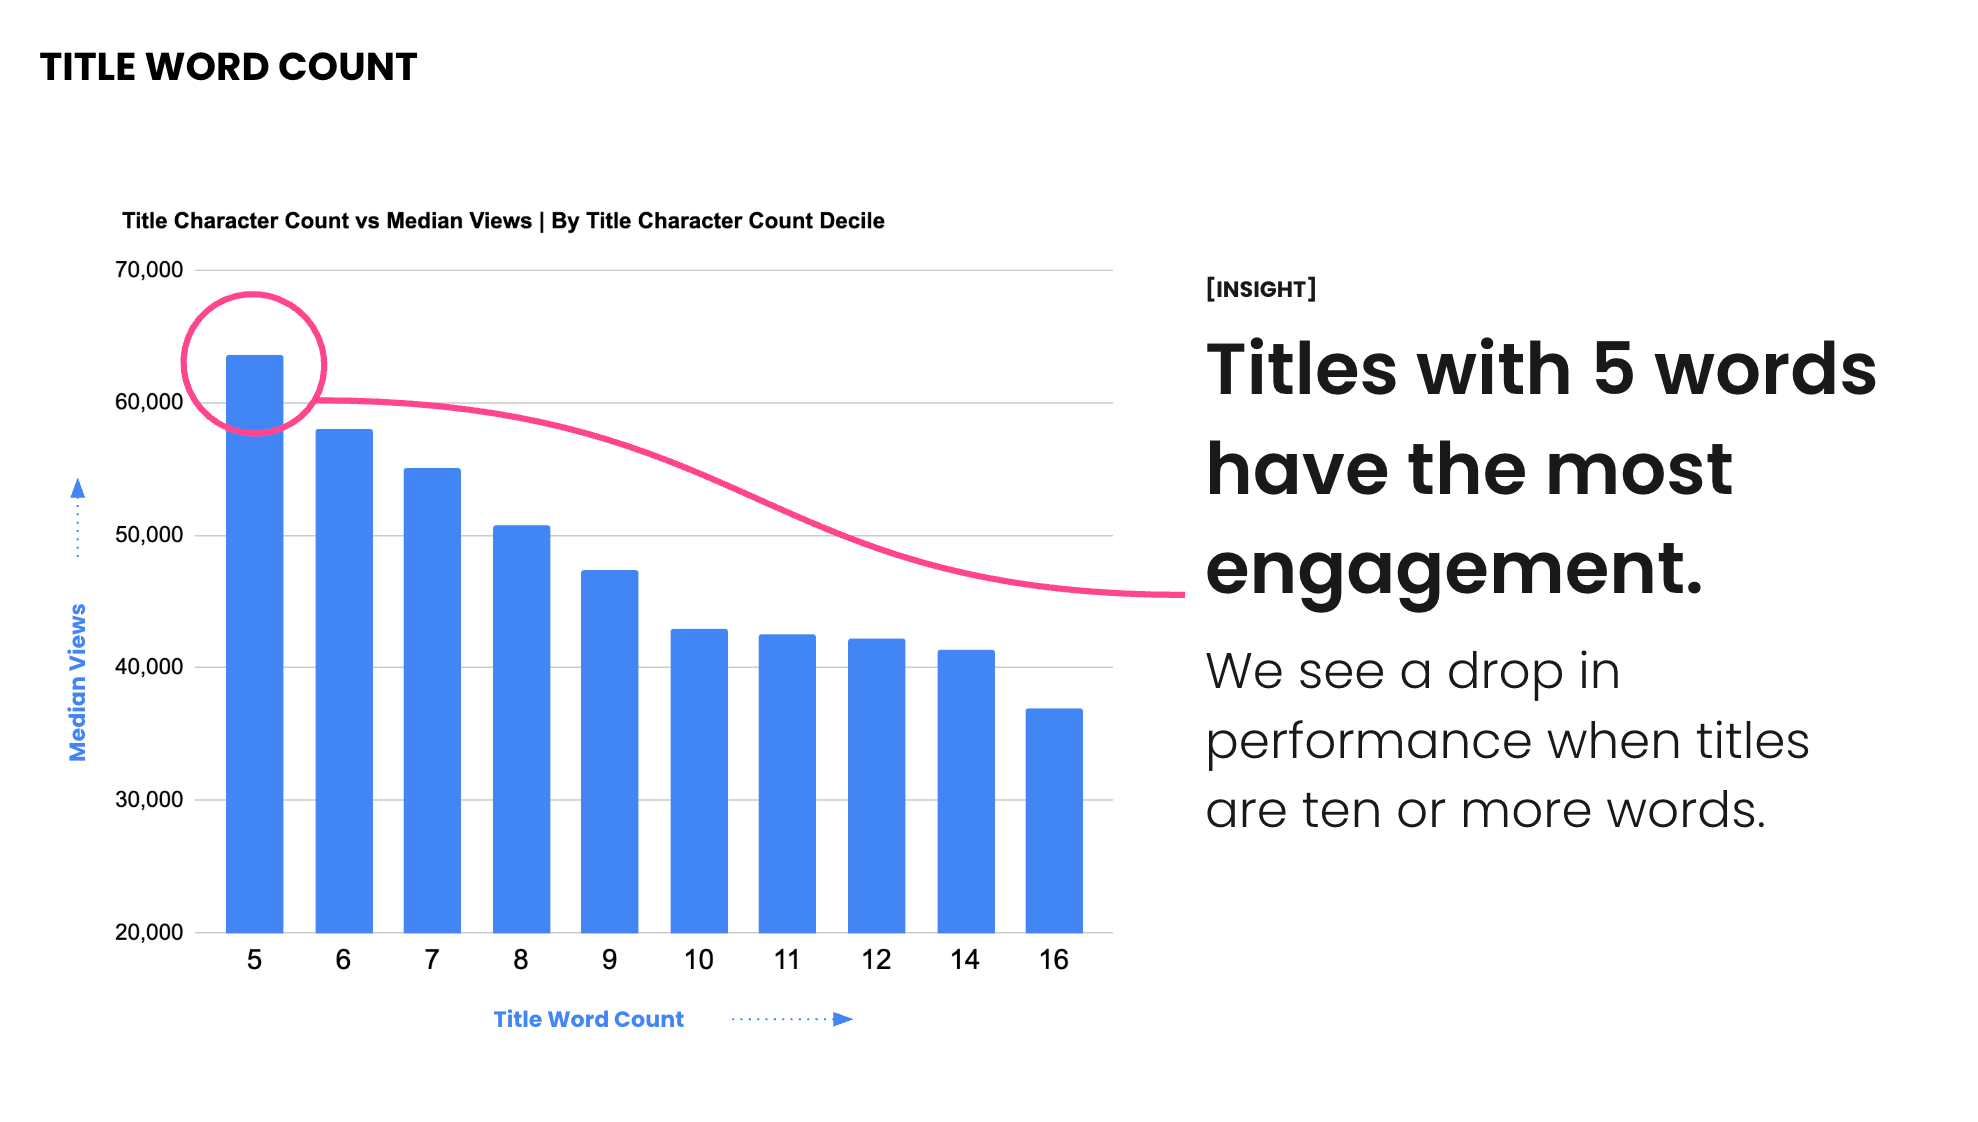
Word count findings
- Titles with 5 words have the highest median engagement
- Performance declines steadily after 6 words
- Titles with 10+ words underperform significantly
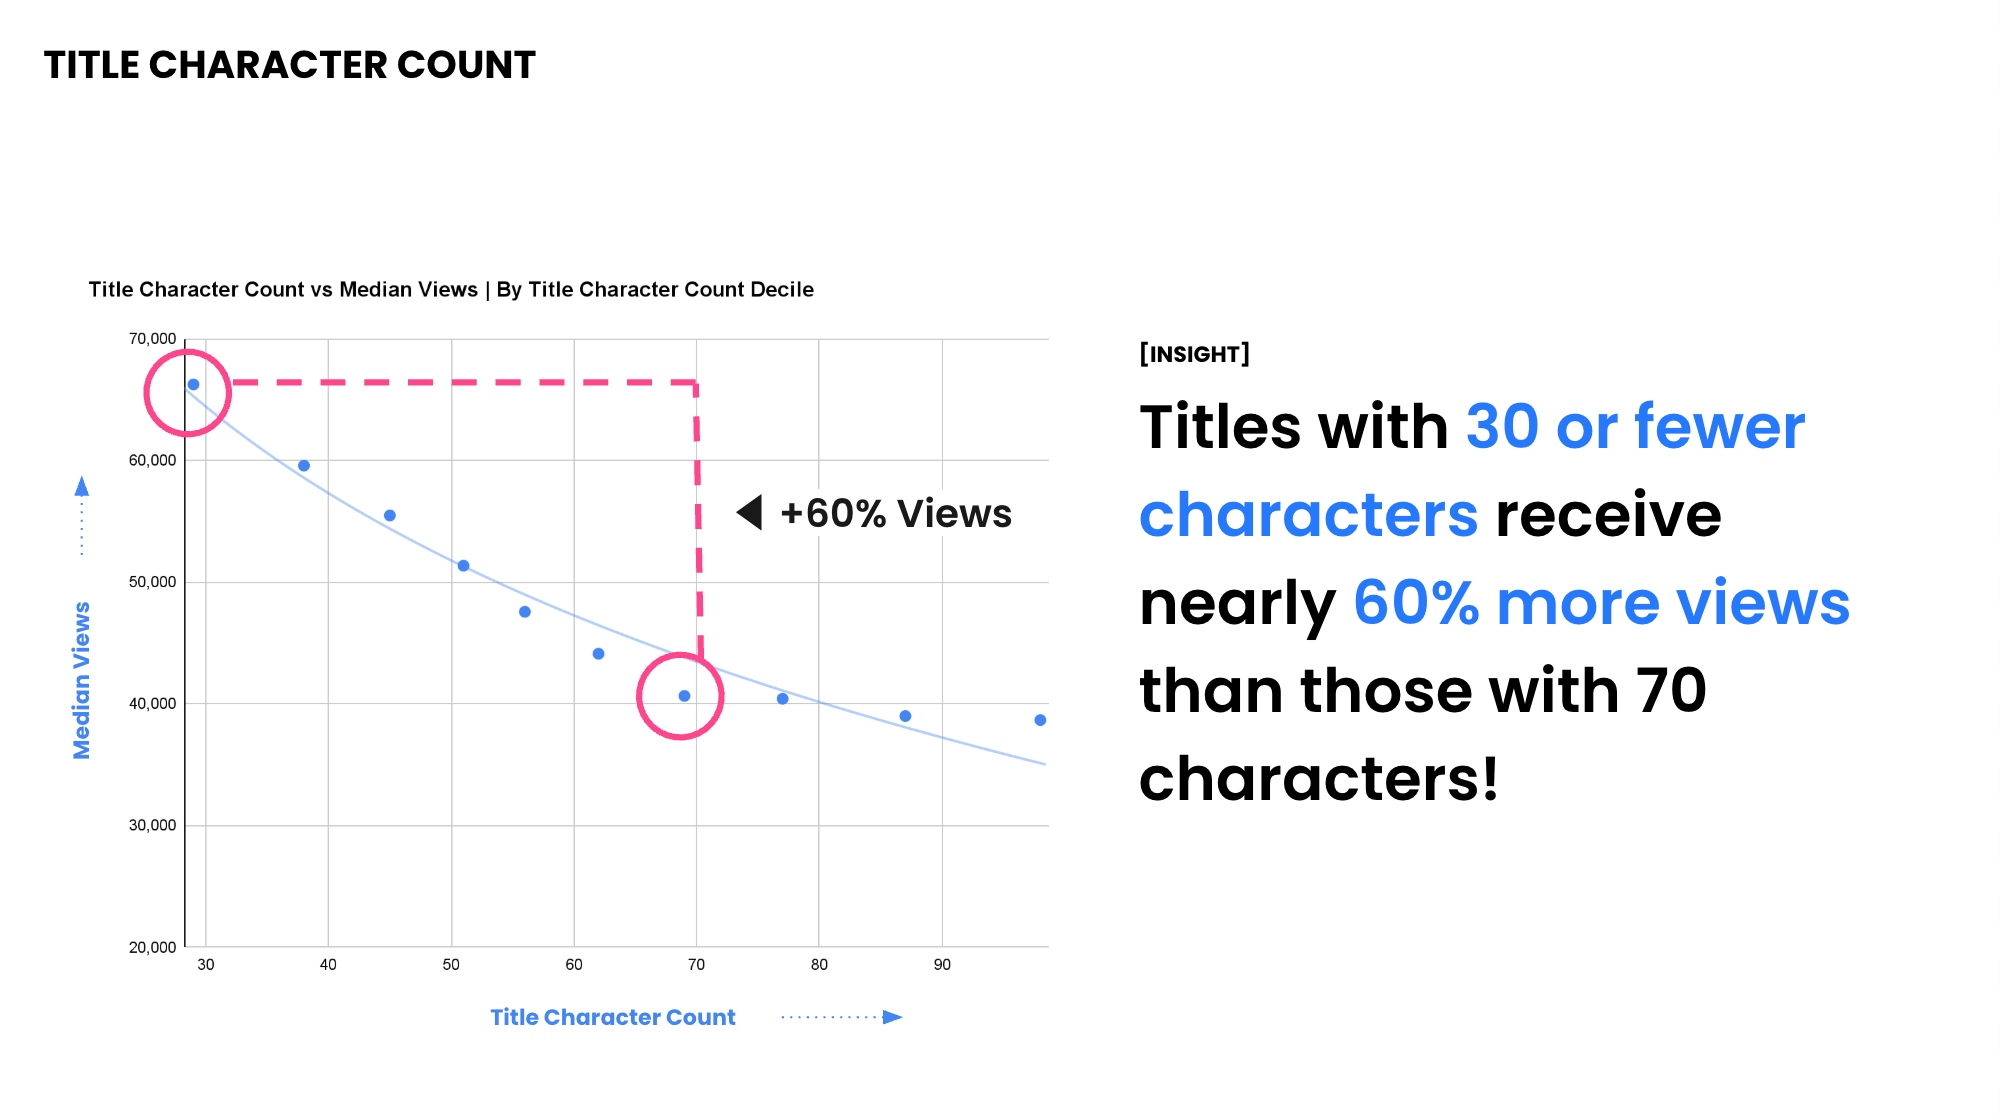
Character count findings
- Titles with ≤30 characters receive ~60% more views
- Titles near 70 characters perform the worst
Why this happens
Short titles:
- Are processed faster
- Create clearer curiosity gaps
- Leave room for the thumbnail to do its job
Long titles:
- Compete with the thumbnail
- Increase reading friction
- Signal “work” instead of intrigue
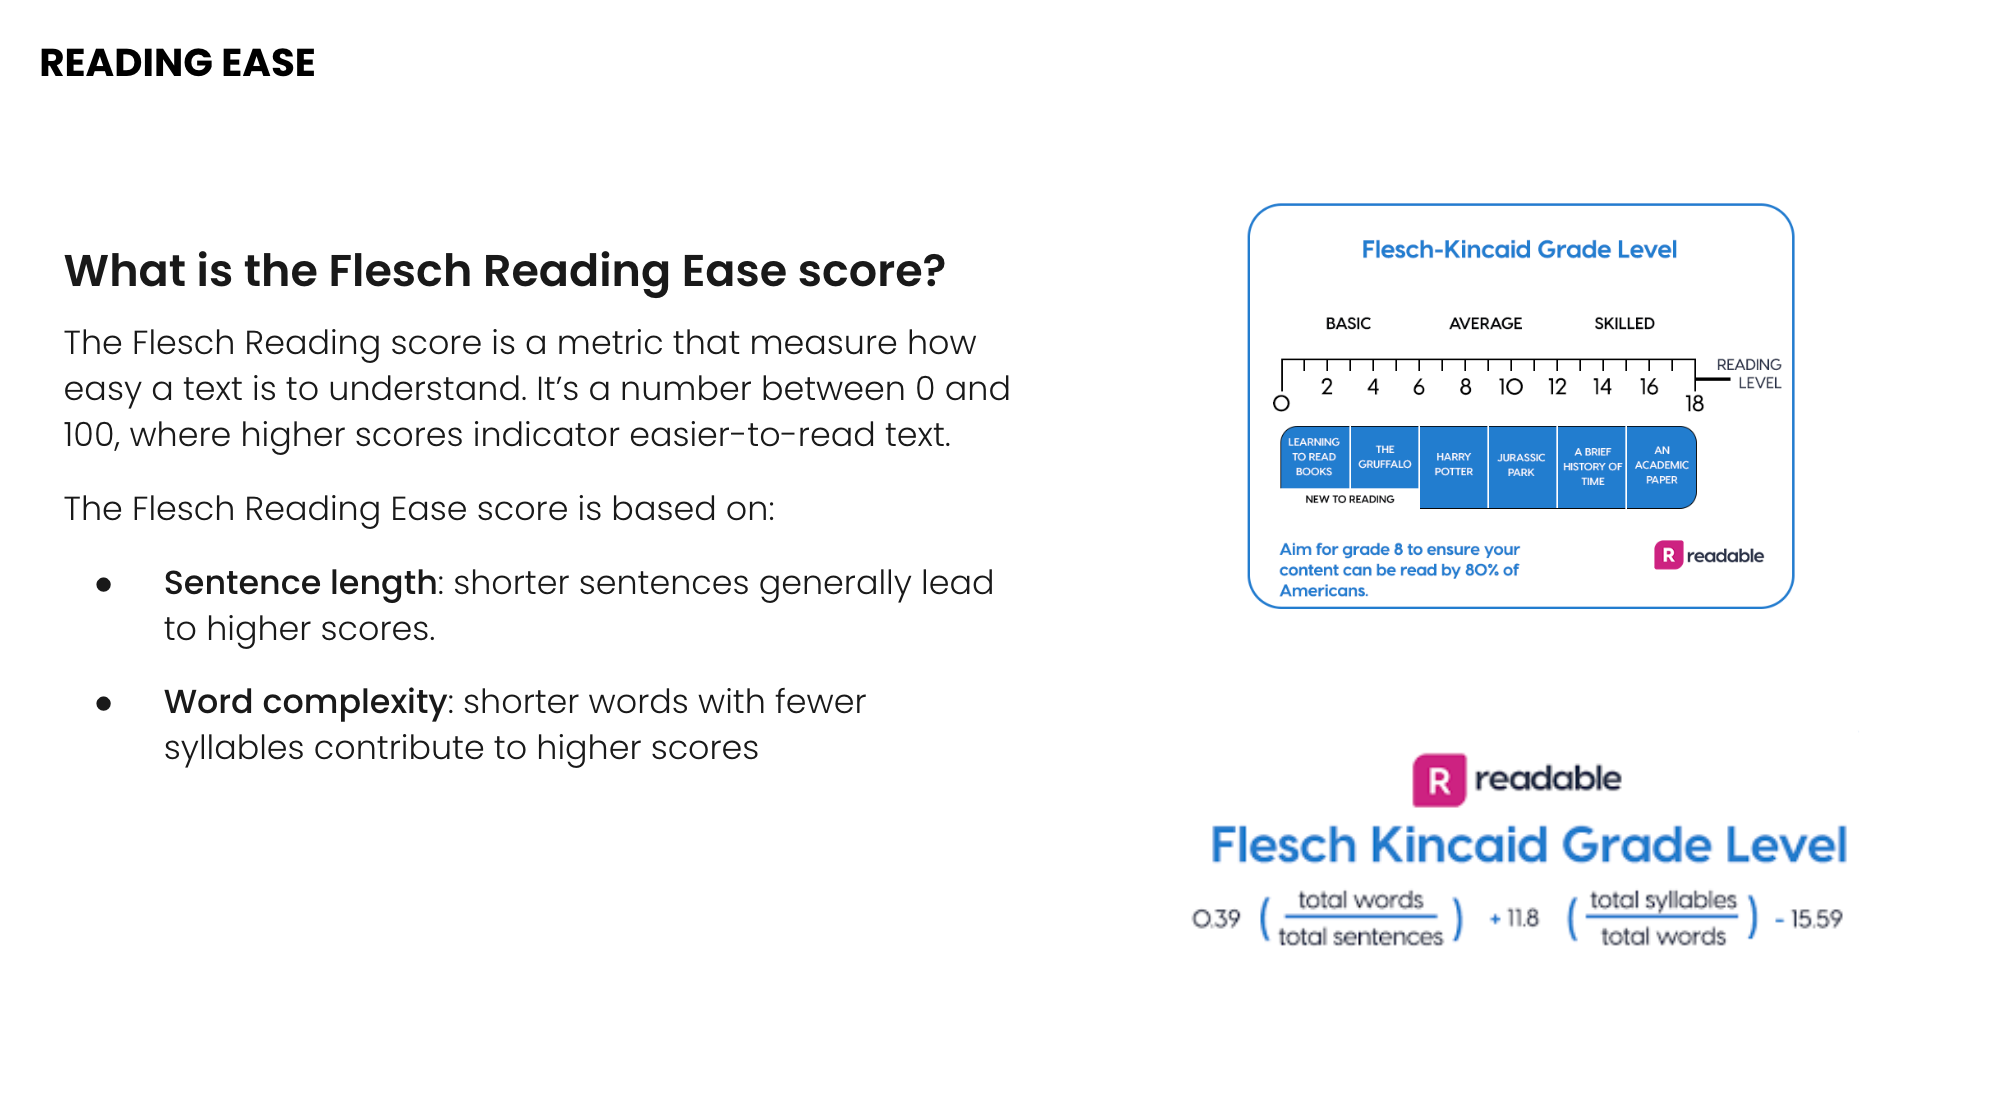
3) Readability
We calculated Flesch Reading Ease for every title.
This score measures:
- Sentence length
- Word complexity
- Syllable count
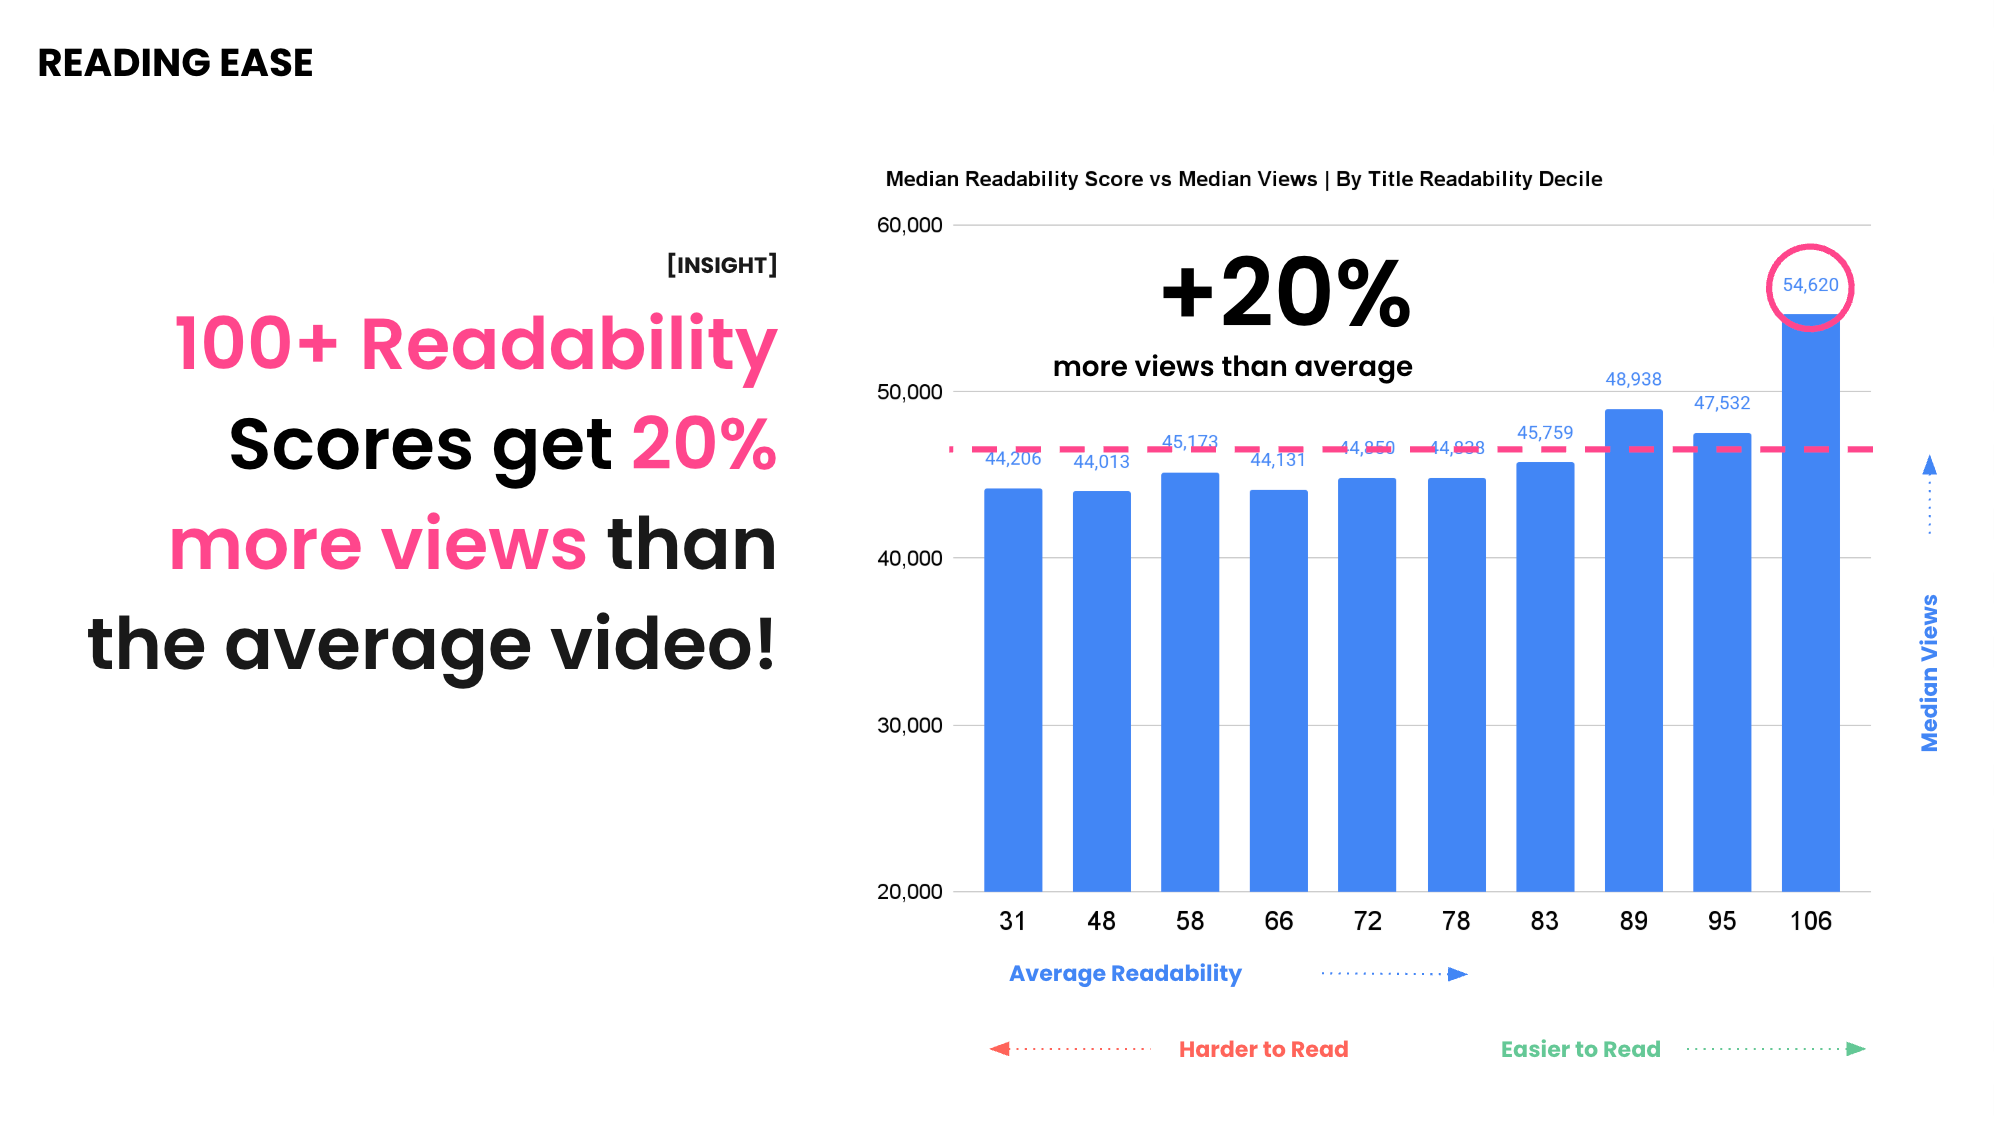
The result
Titles with very high readability scores receive ~20% more views than the average video.
What high-performing titles have in common
- Short words
- Spoken language
- Familiar phrasing
- Minimal punctuation
You are not rewarded for sounding intelligent.
You are rewarded for sounding instantly understandable.
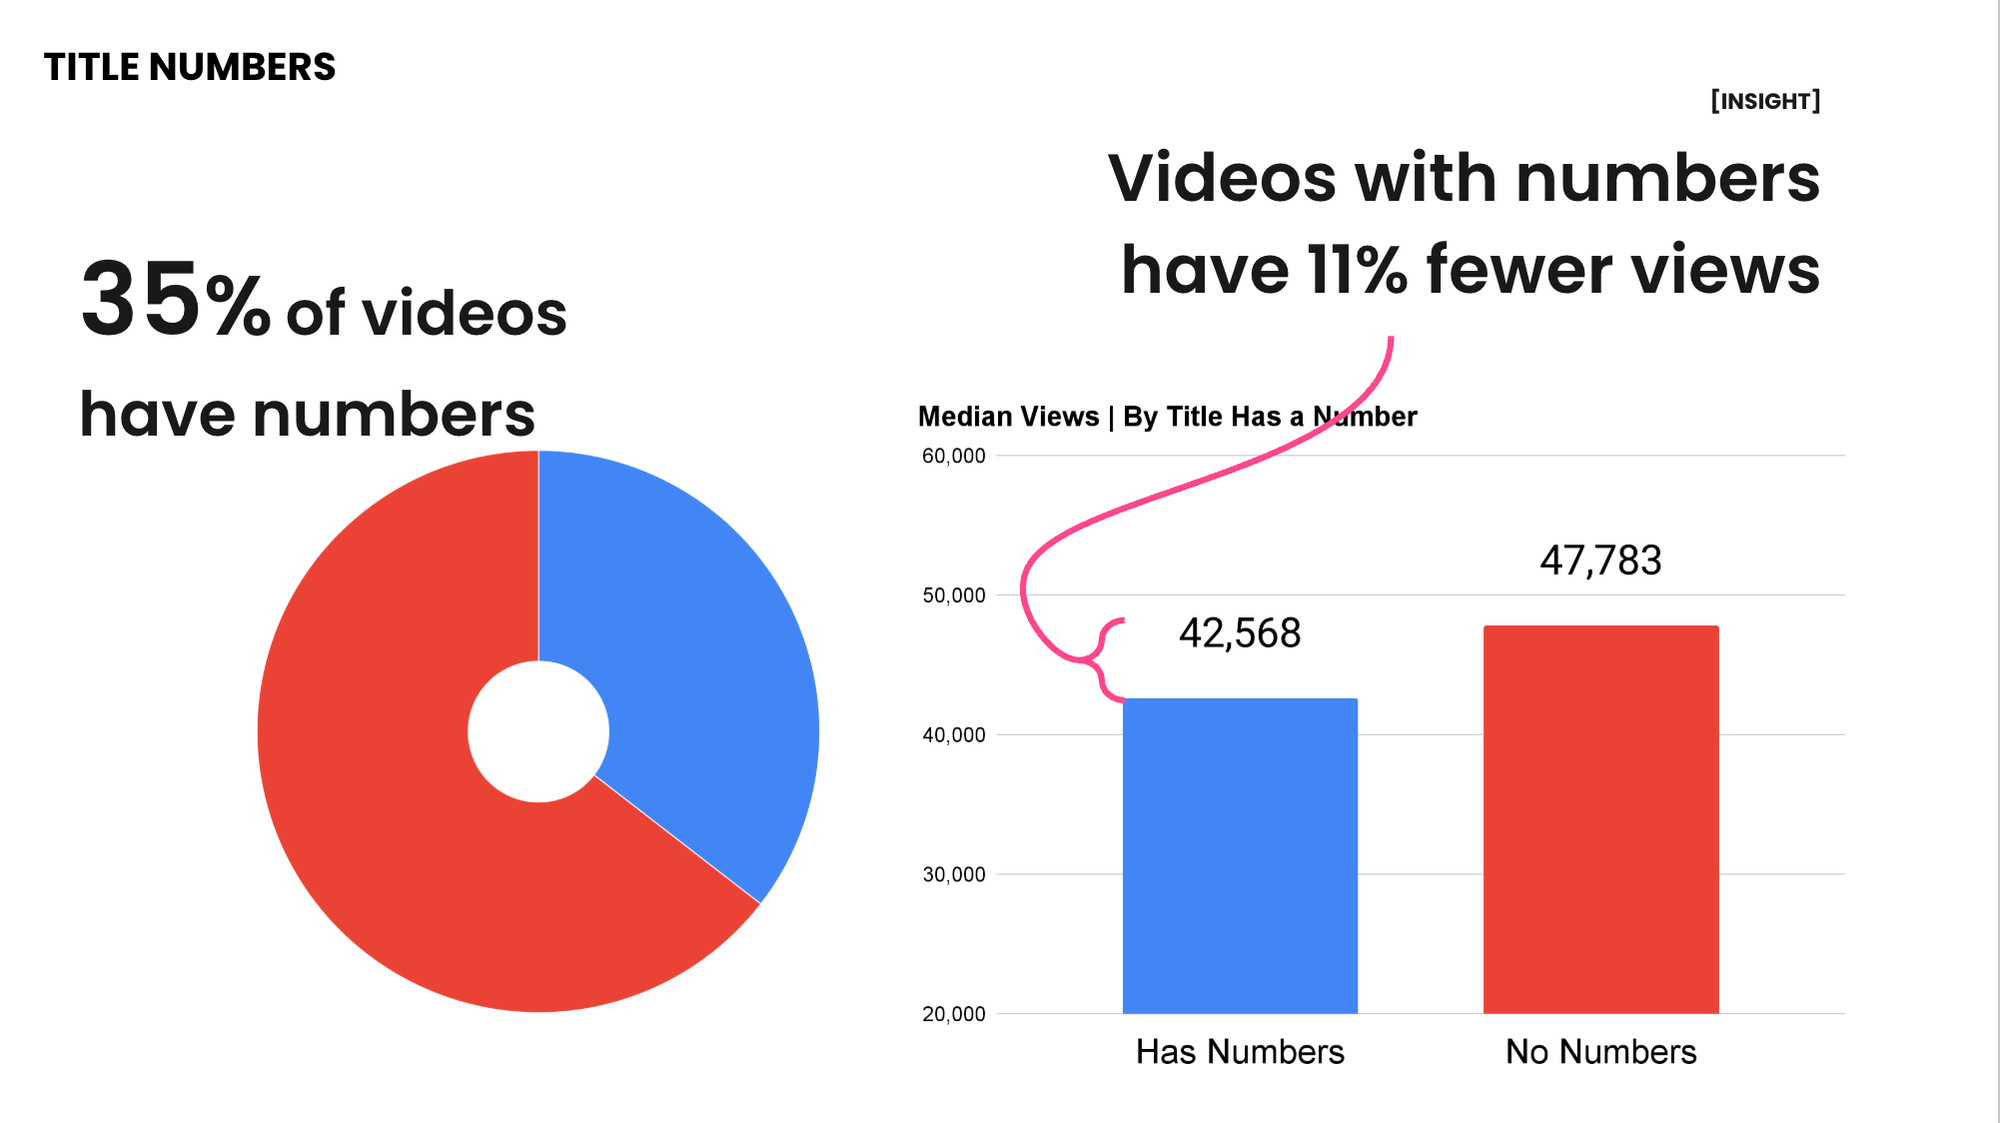
4) Numbers in Titles
Numbers are everywhere:
- “10 tips”
- “5 mistakes”
- “7 things”
But the data shows:
- 35% of titles include numbers
- Titles with numbers get ~11% fewer views on average
Important nuance:
- Numbers don’t prevent virality
- But they rarely help it
Numbers add structure, but structure often reduces curiosity.
5) Title Sentiment
Only 11% of titles are classified as negative.
Yet they receive ~22% more views than positive titles.
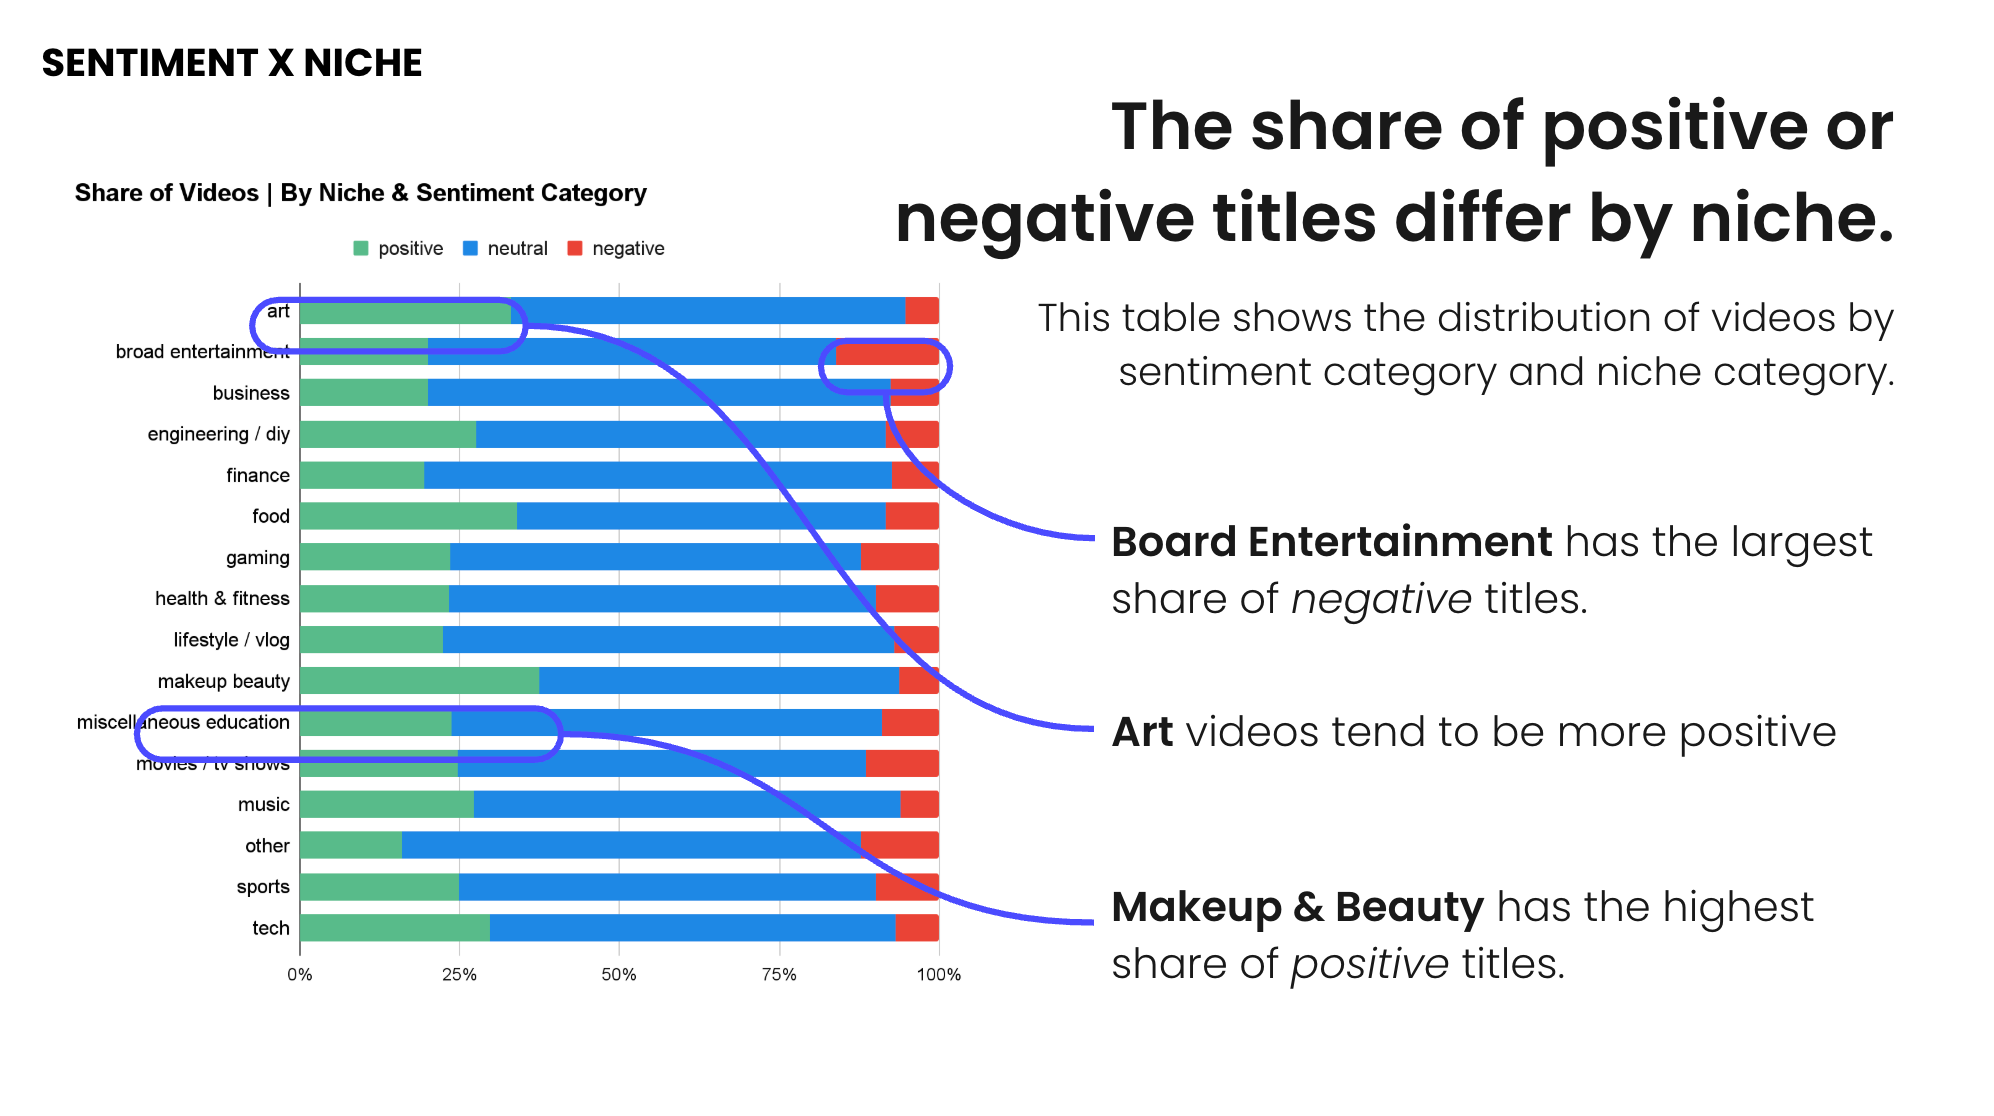
This pattern holds across:
- Educational content
- Entertainment content
- Nearly every niche
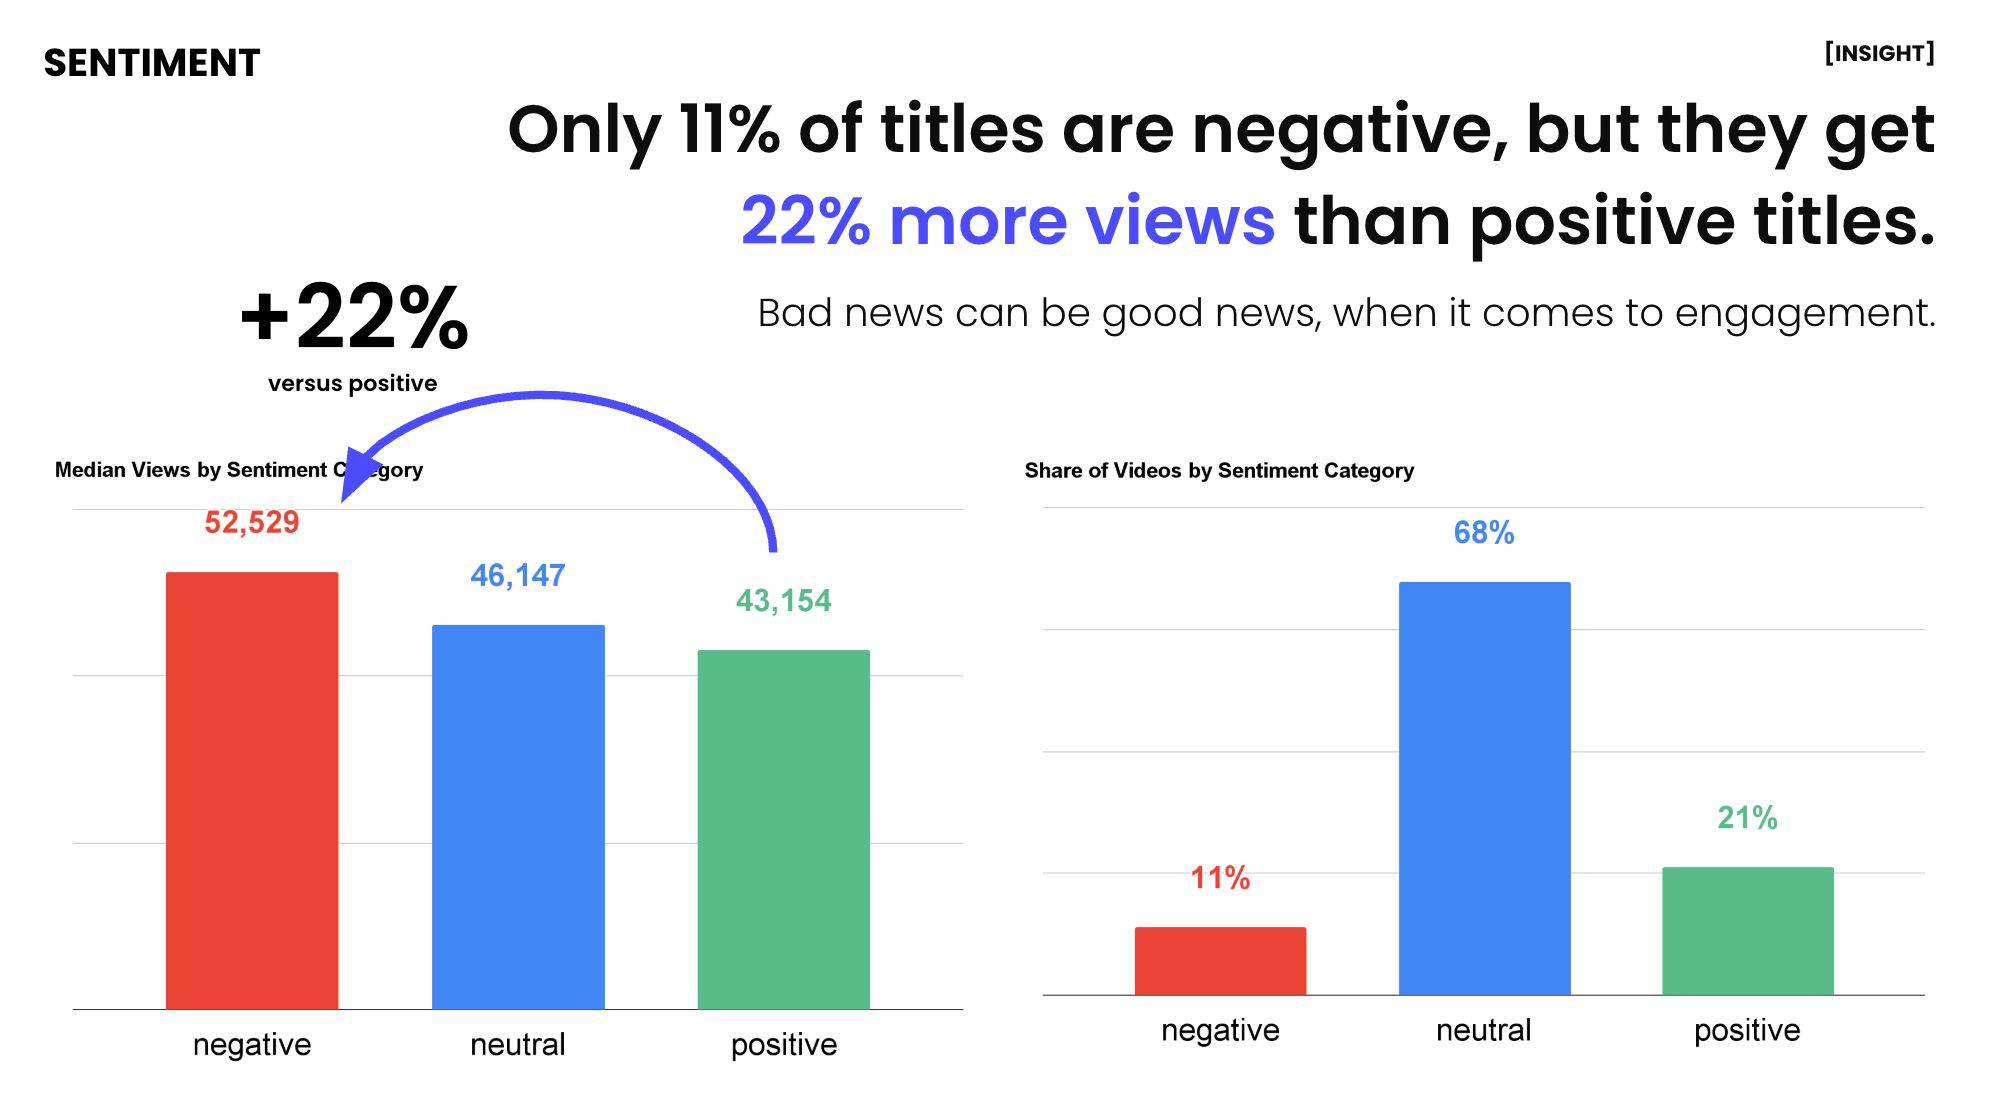
Why negativity works
Negative framing:
- Signals urgency
- Creates tension
- Implies conflict or revelation
Humans are loss-averse.
Negative framing exploits that bias.
Even in traditionally “positive” niches like Makeup & Beauty, negative titles outperform positive ones.
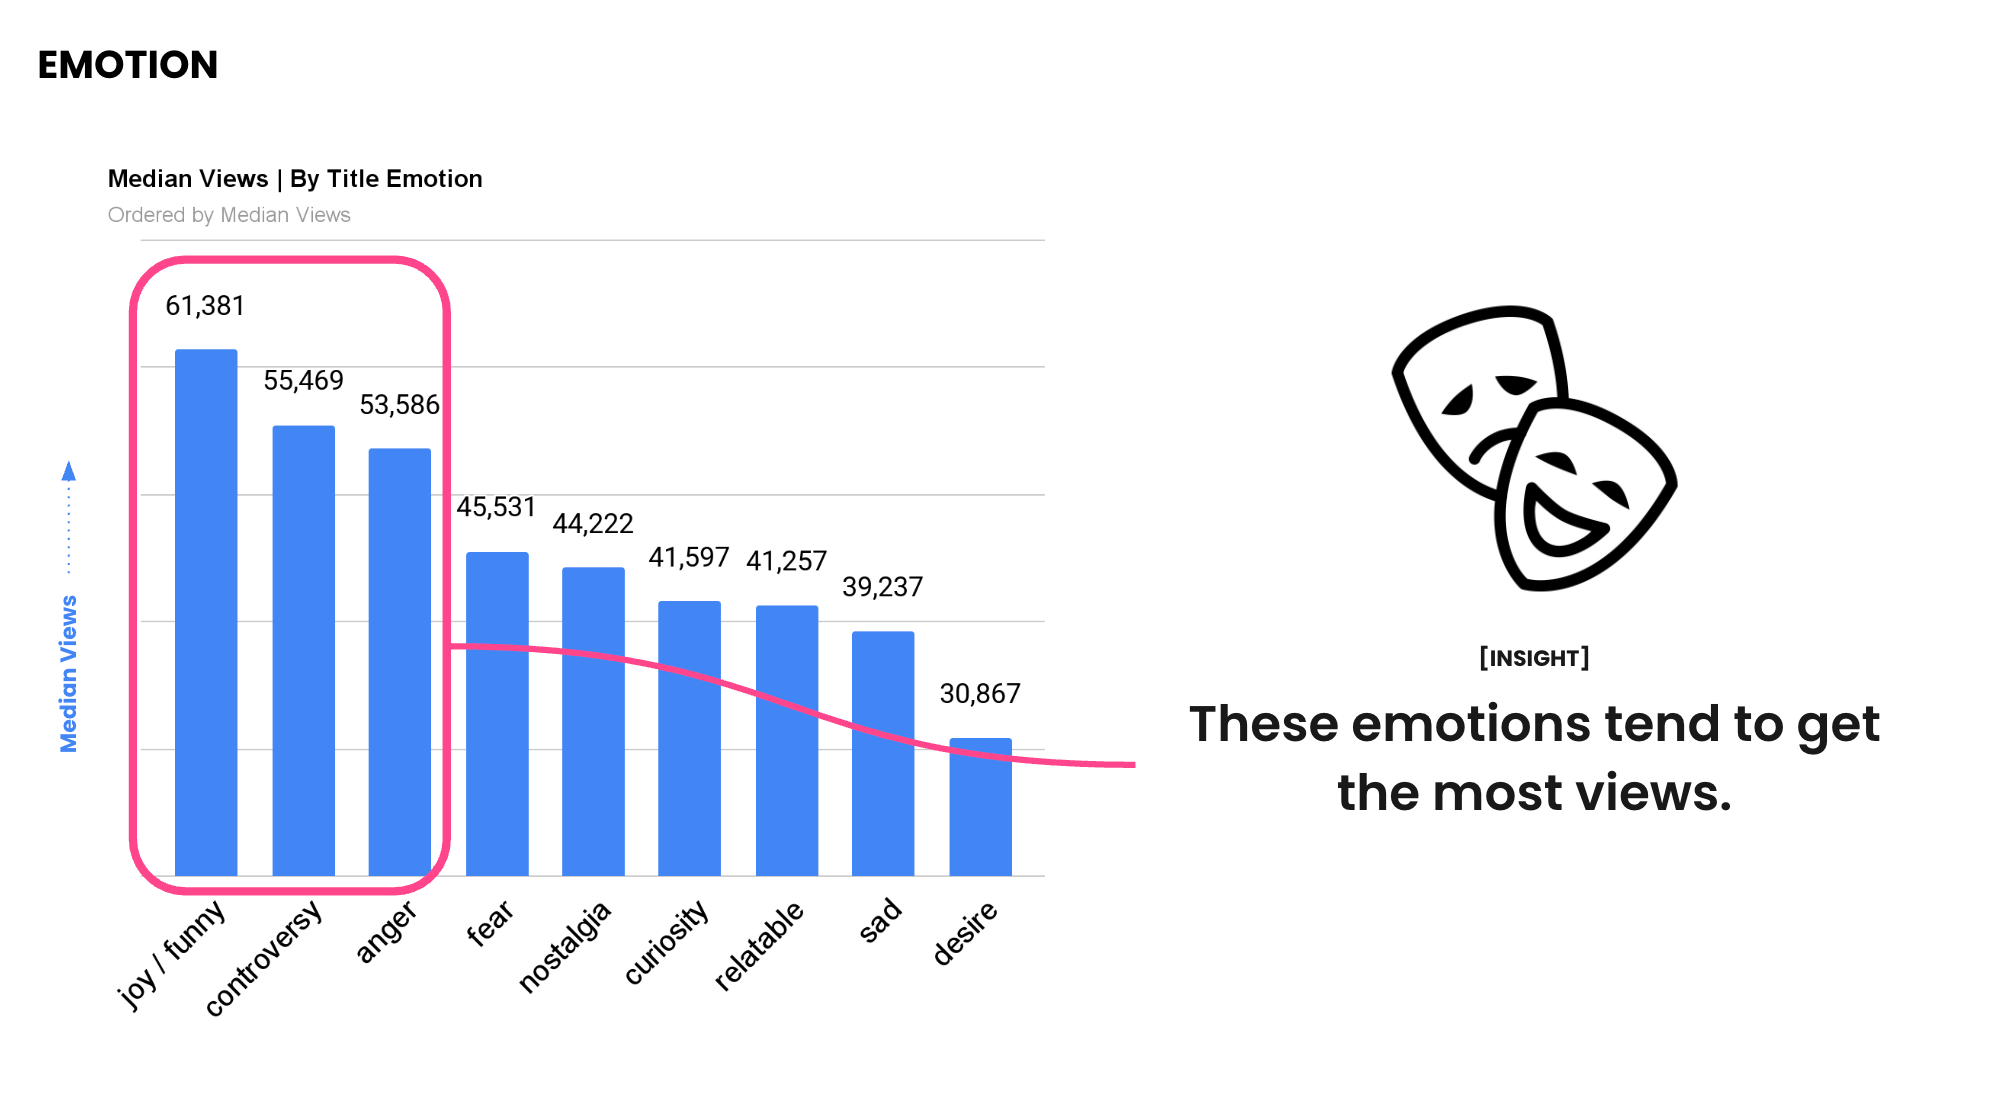
6) Title Emotion
Using LLMs, we classified the dominant emotional tone of titles.
Highest-performing emotions:
- Joy / Funny
- Anger
- Controversy
Neutral or purely informational titles consistently underperform.
Emotion is not optional.
It is the delivery mechanism.
7) Entertainment vs Education
There is roughly an even split between:
- Entertainment uploads
- Educational uploads
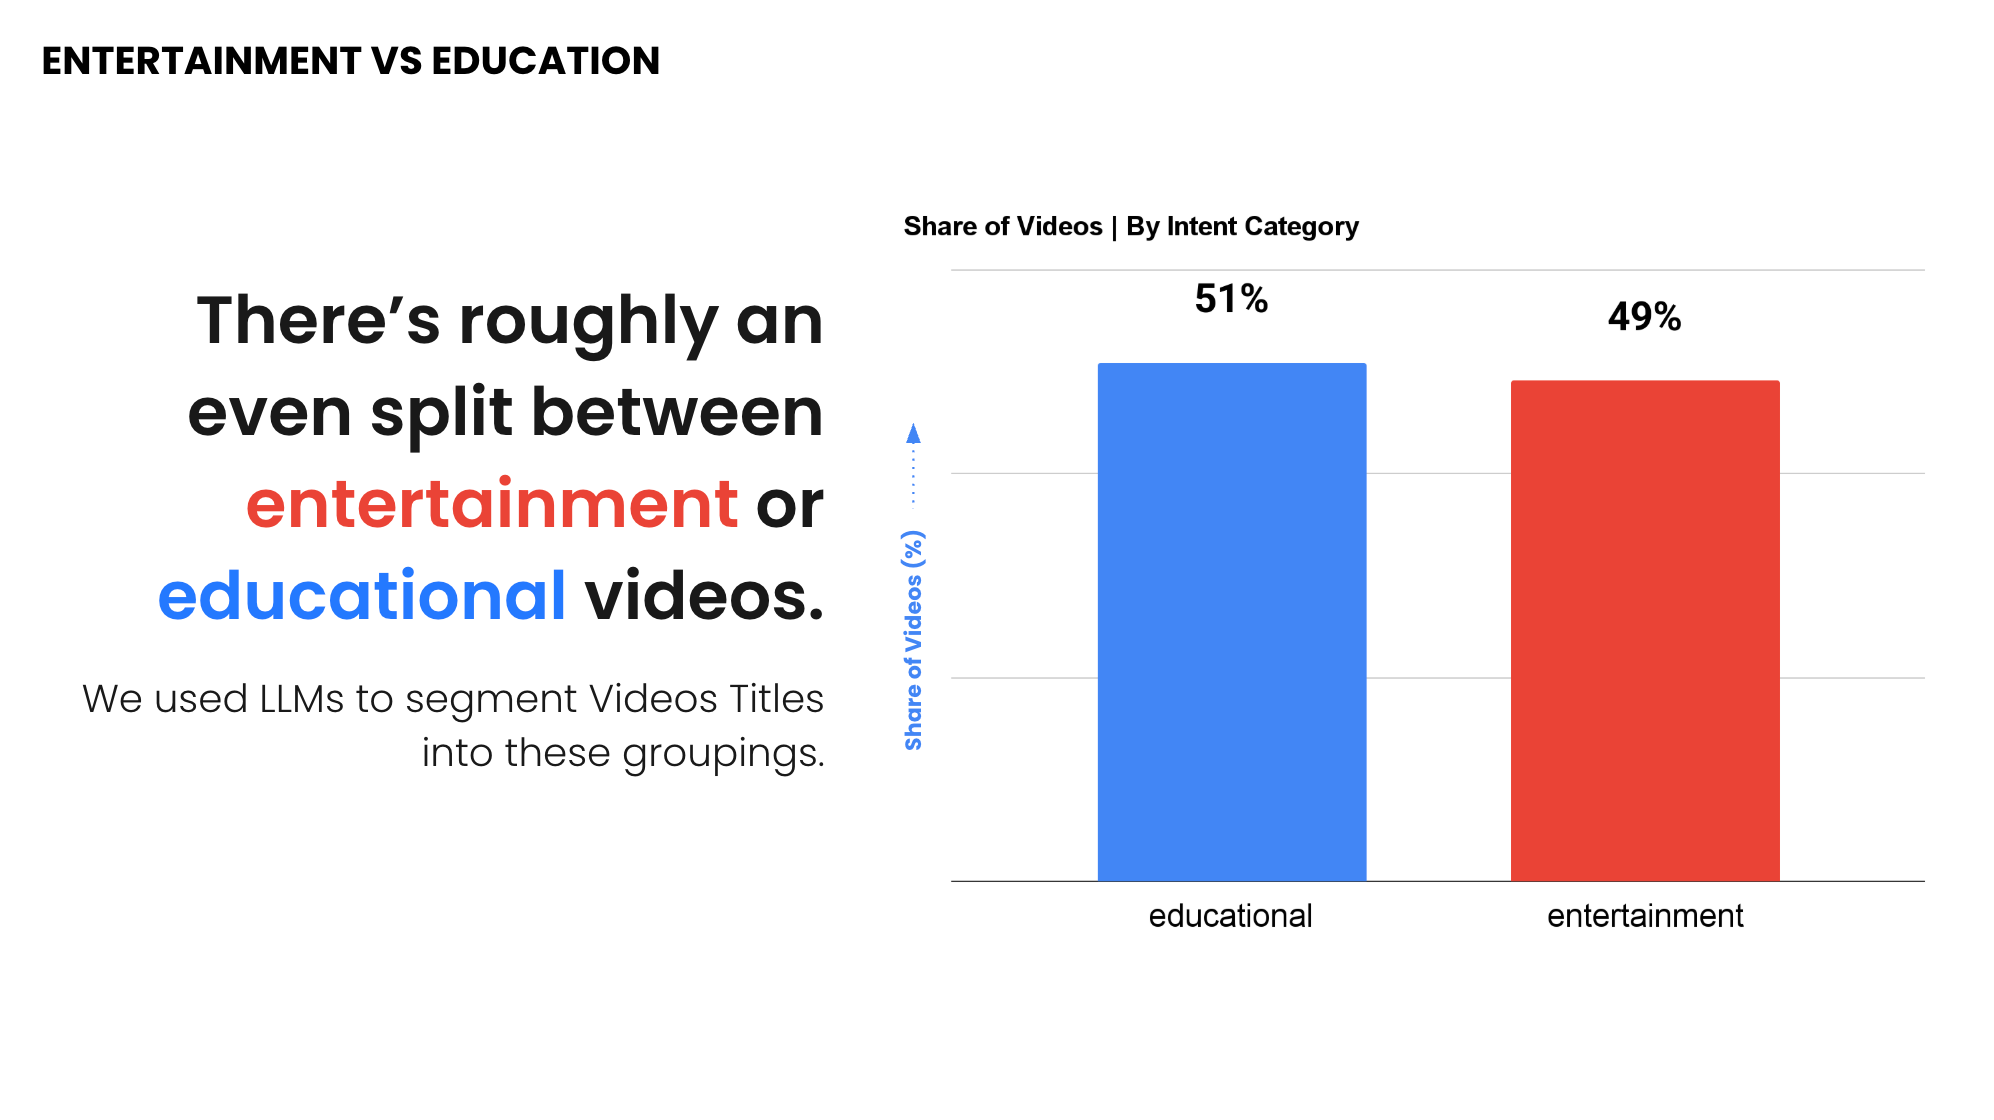
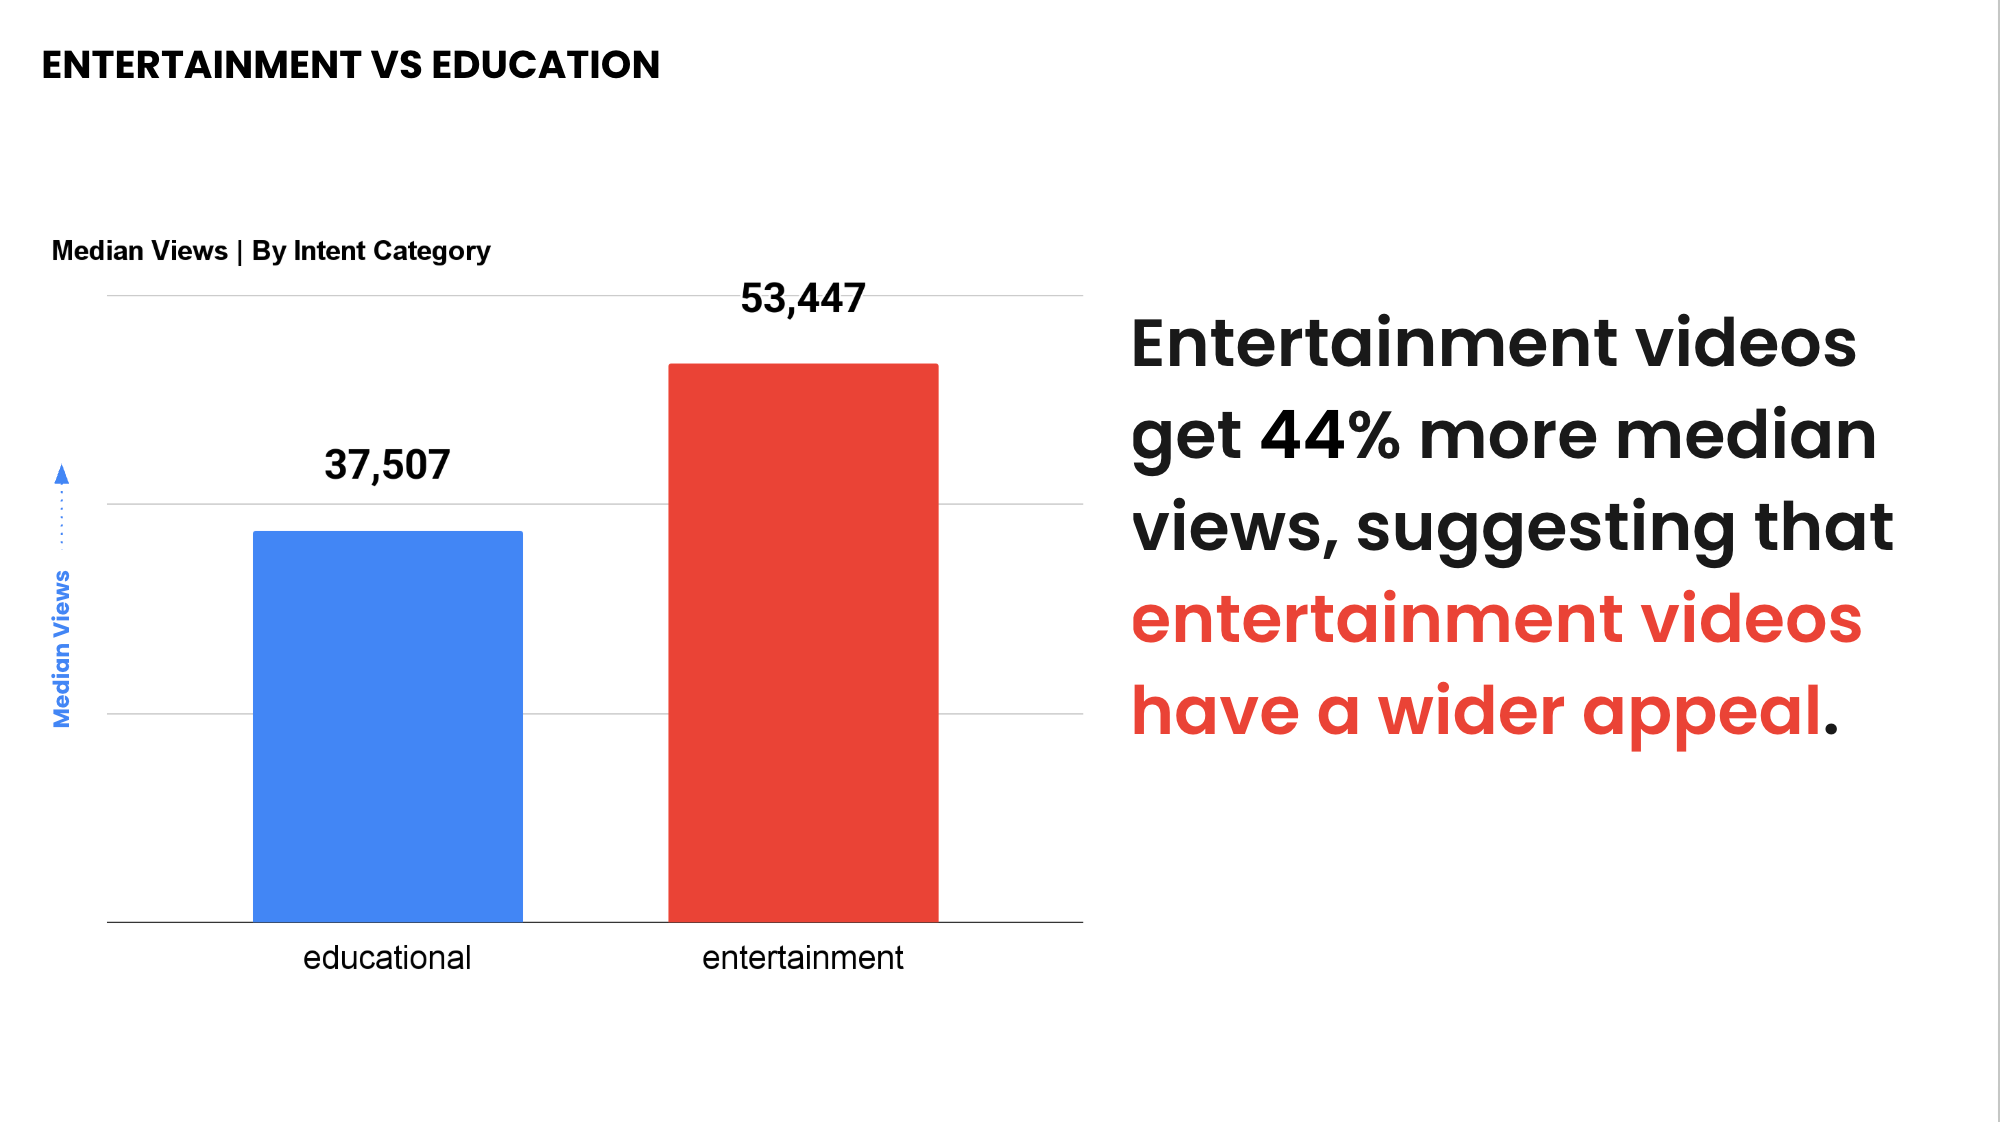
But median performance differs sharply.
- Entertainment videos earn ~44% more median views
- Educational videos rely more on authority and loyalty
Education can still scale, but it must:
- Borrow entertainment framing
- Use emotional hooks
- Avoid lecture-style packaging
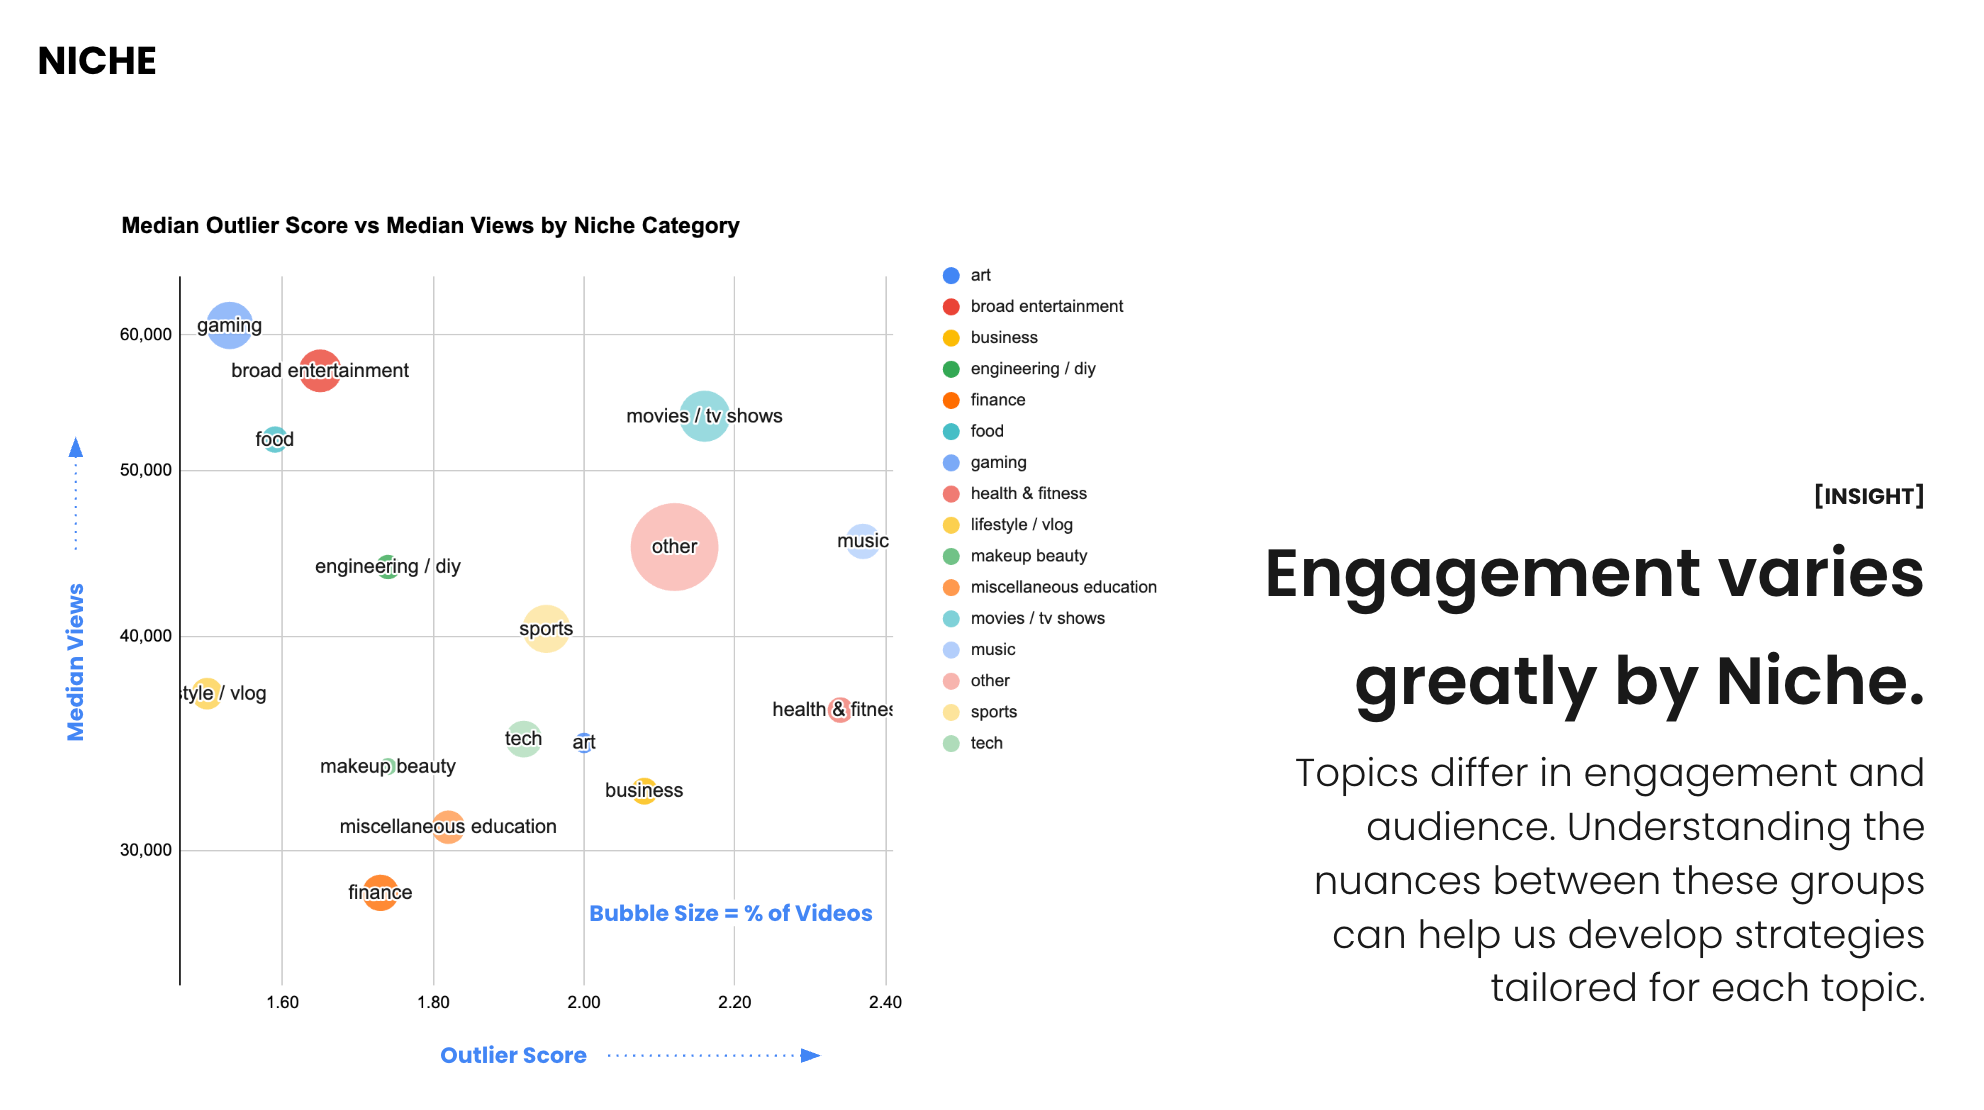
8) Top YouTube Niches by Viral Potential
We identified three macro-groups:
1. Blockbuster Niches
High upside, high variance:
- Movies & TV
- Music
- Politics / History
2. Broad Interest Niches
Massive audiences, consistent demand:
- Gaming
- Broad entertainment
- Food
Gaming alone earns 31% higher median views than the platform average.
3. Community Niches
Smaller reach, stronger loyalty:
- Business
- Sports
- Beauty
- Tech
These niches rely heavily on:
- Packaging quality
- Authority signals
- Trust accumulation
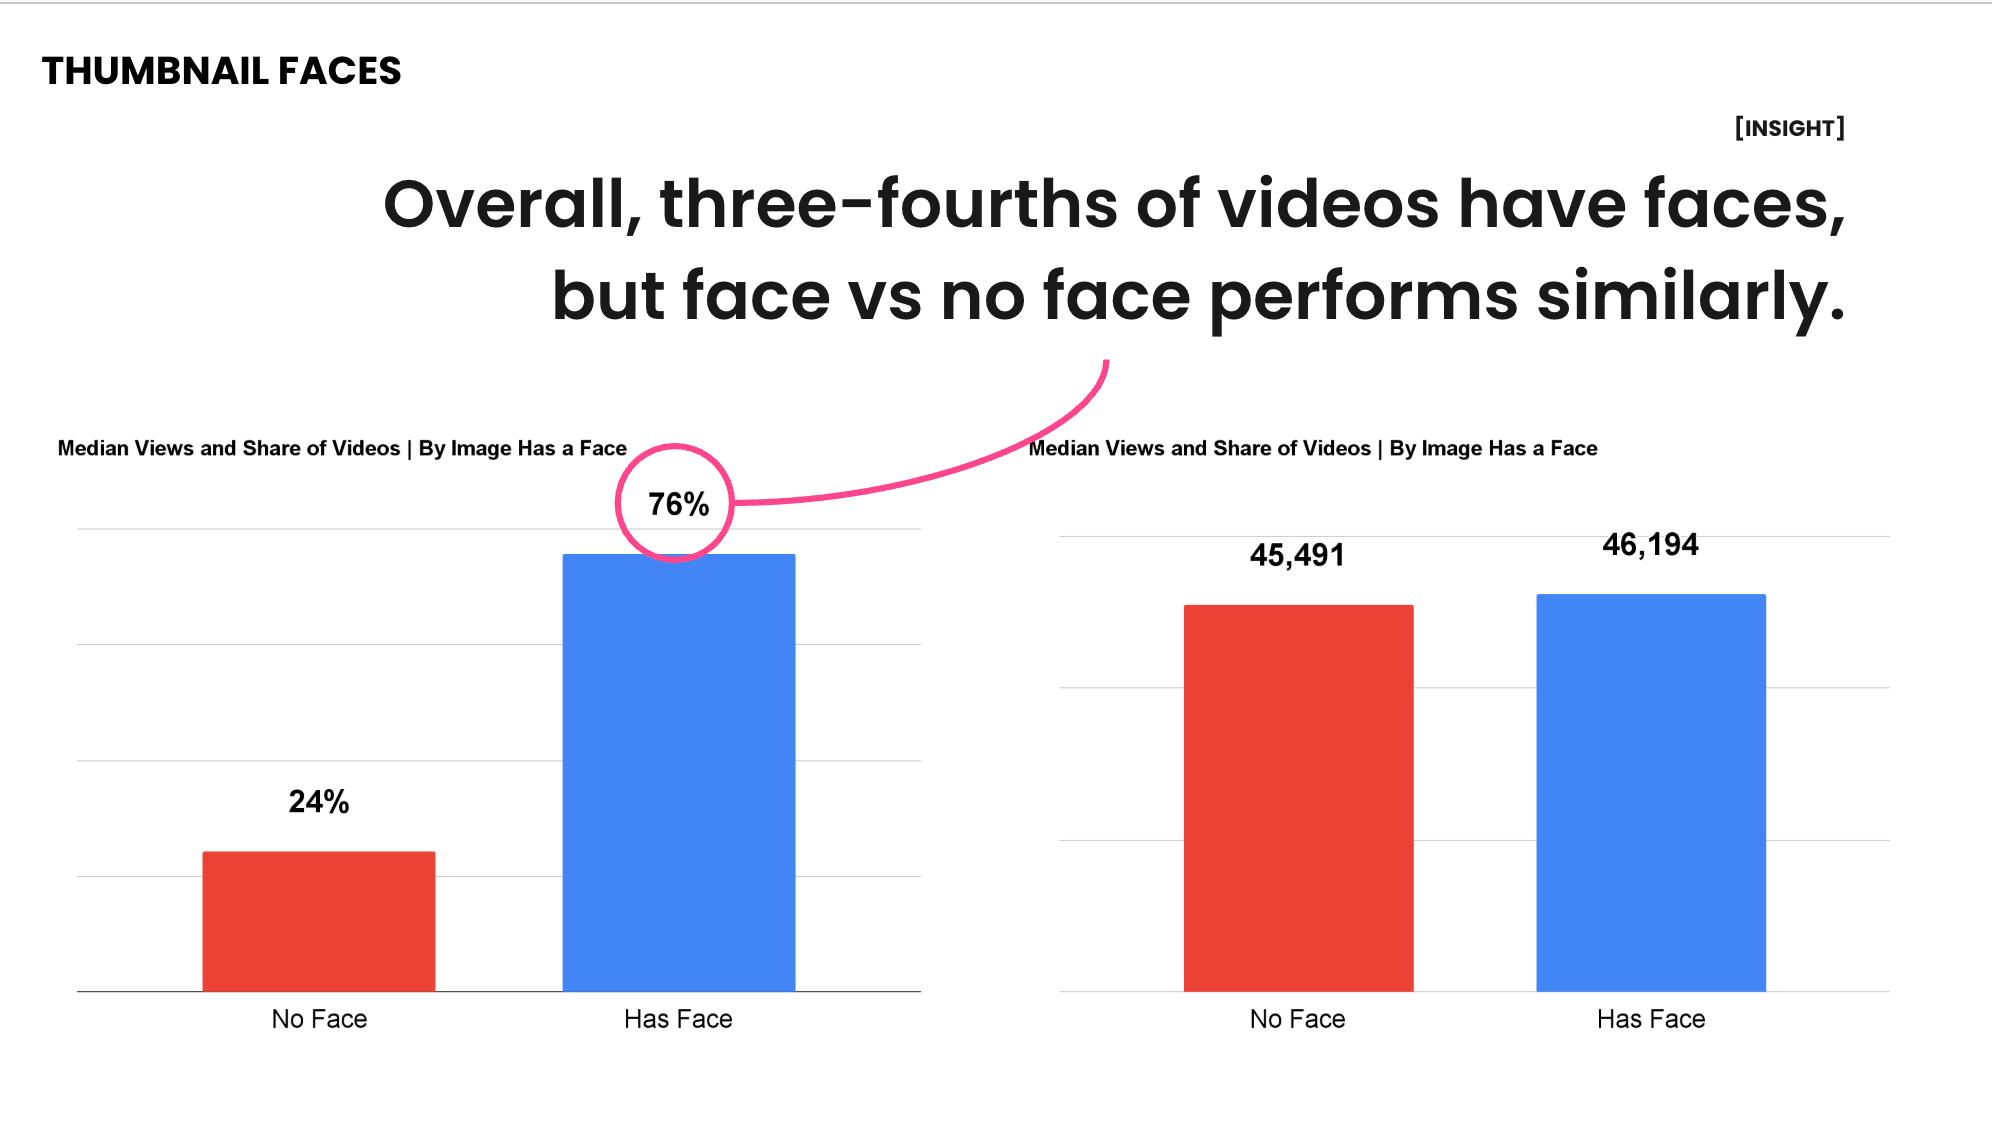
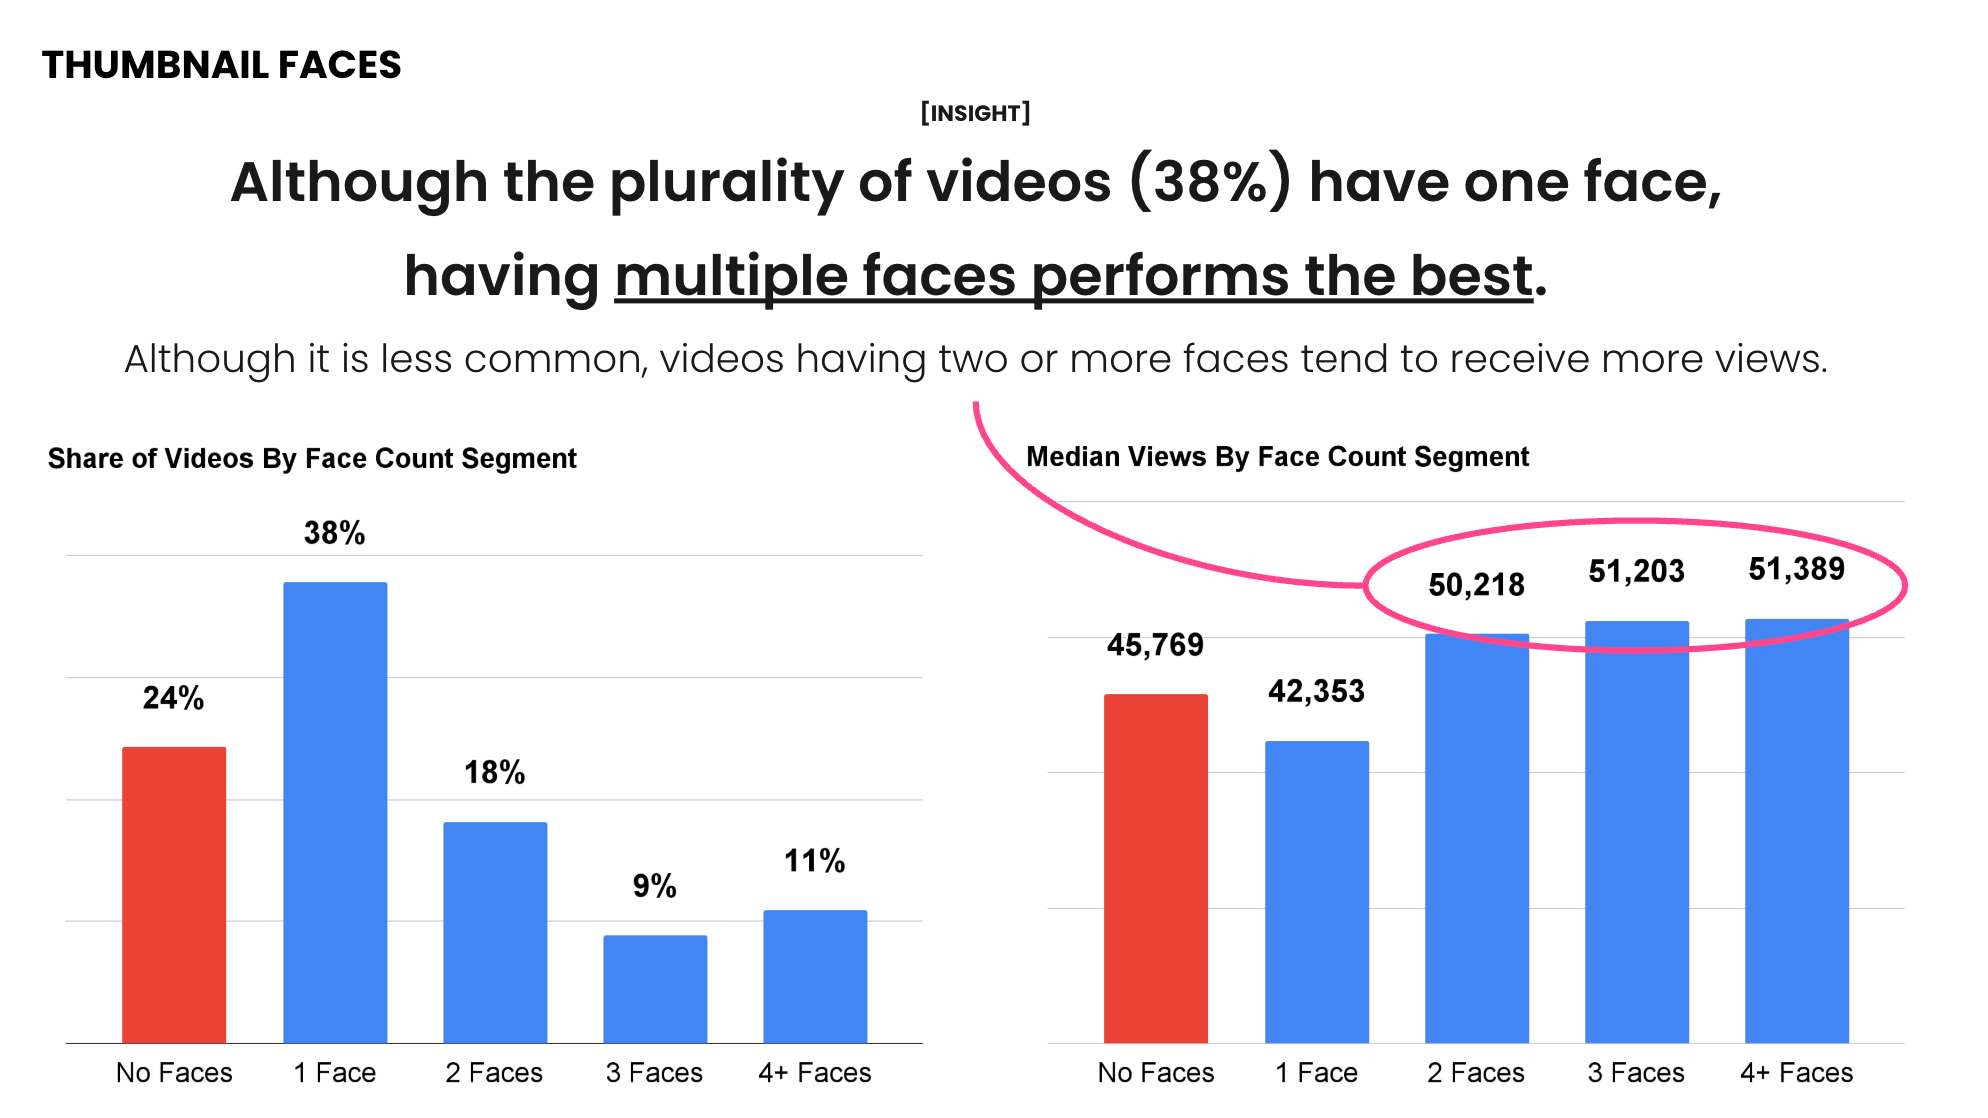
9) Faces in Thumbnails
Contrary to common advice:
- Face vs no face performs similarly overall
- Thumbnails with multiple faces outperform single-face thumbnails
- Faces only meaningfully help channels with 200K+ subscribers
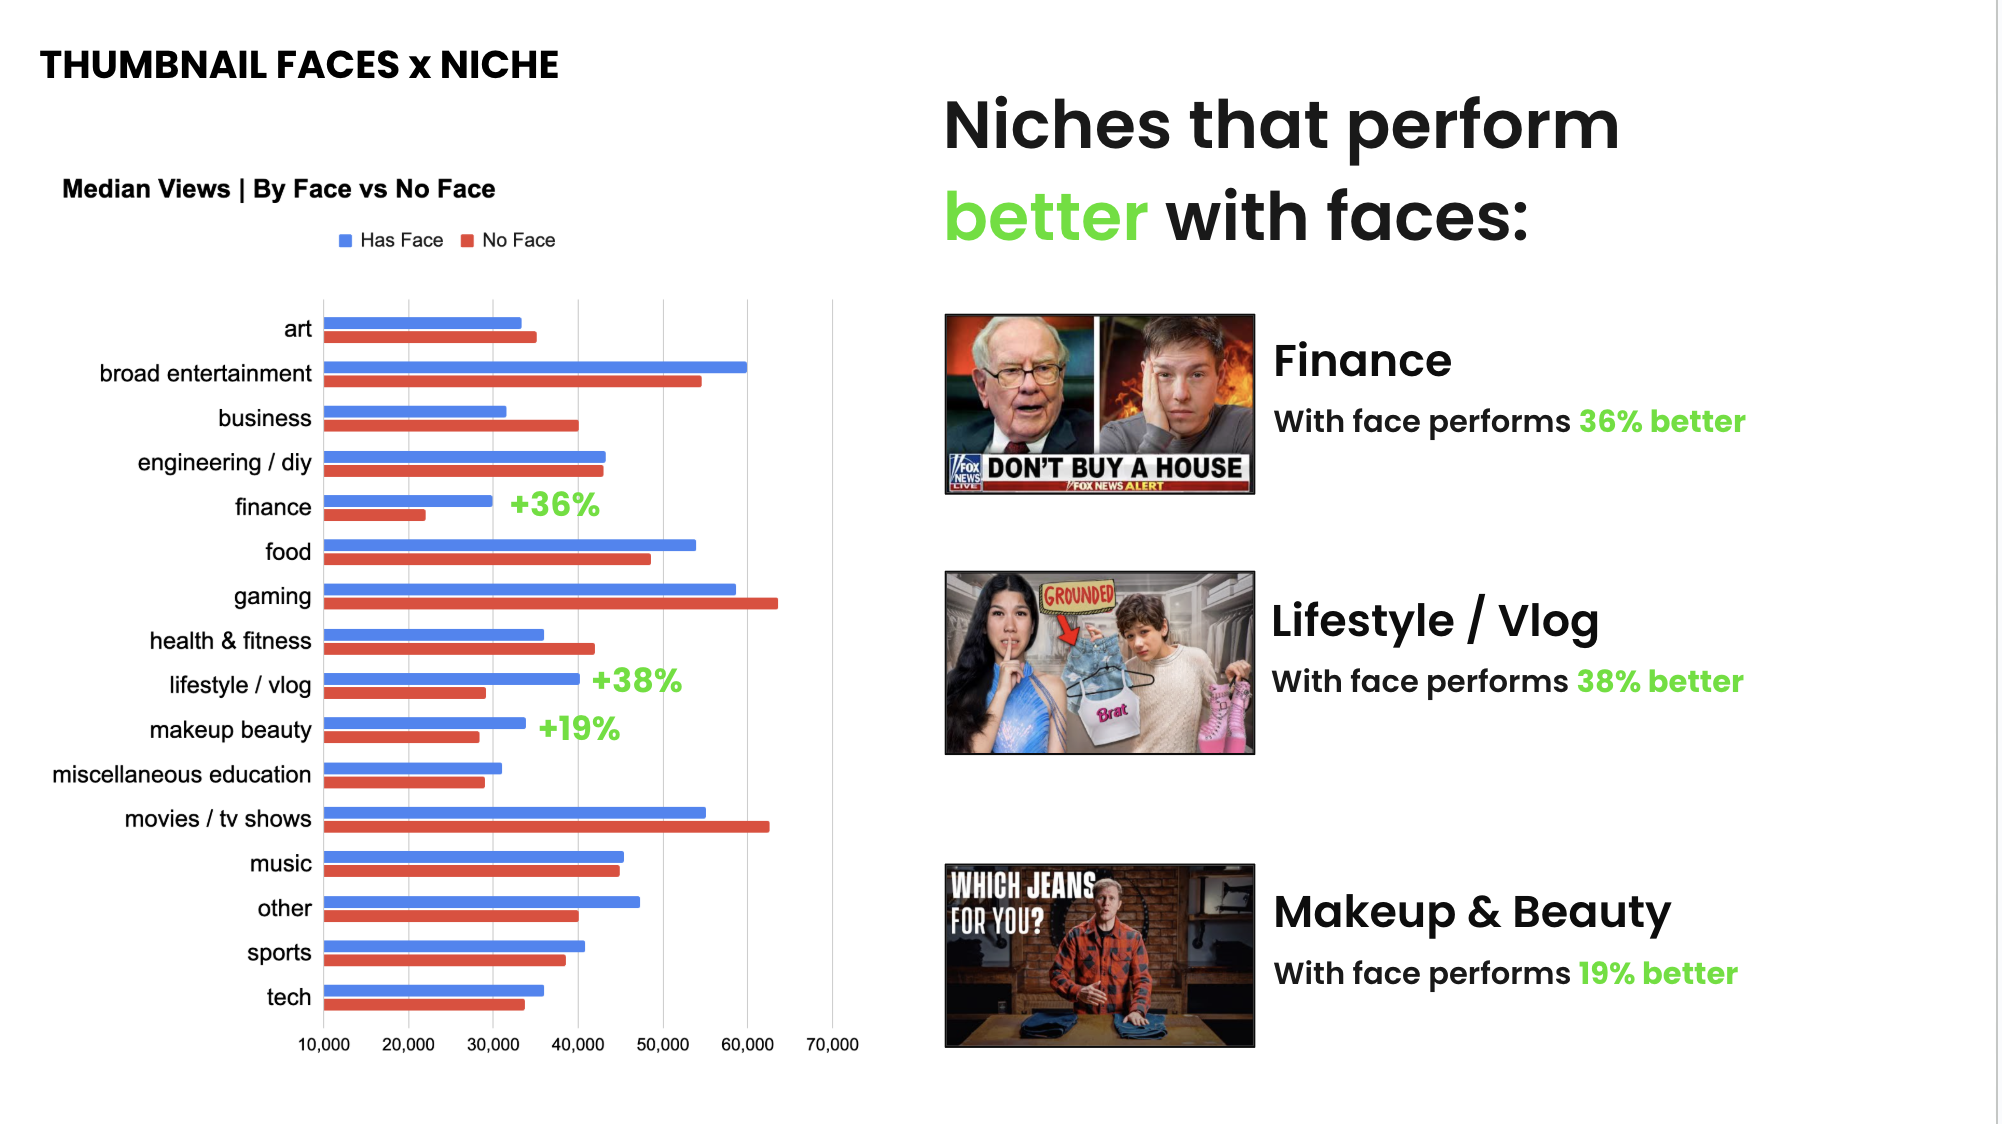
By niche:
Faces help:
- Lifestyle / Vlogs
- Finance
- Beauty
Faces hurt:
- Health & Fitness
- Movies & TV
Faces amplify existing interest, they don’t create it.
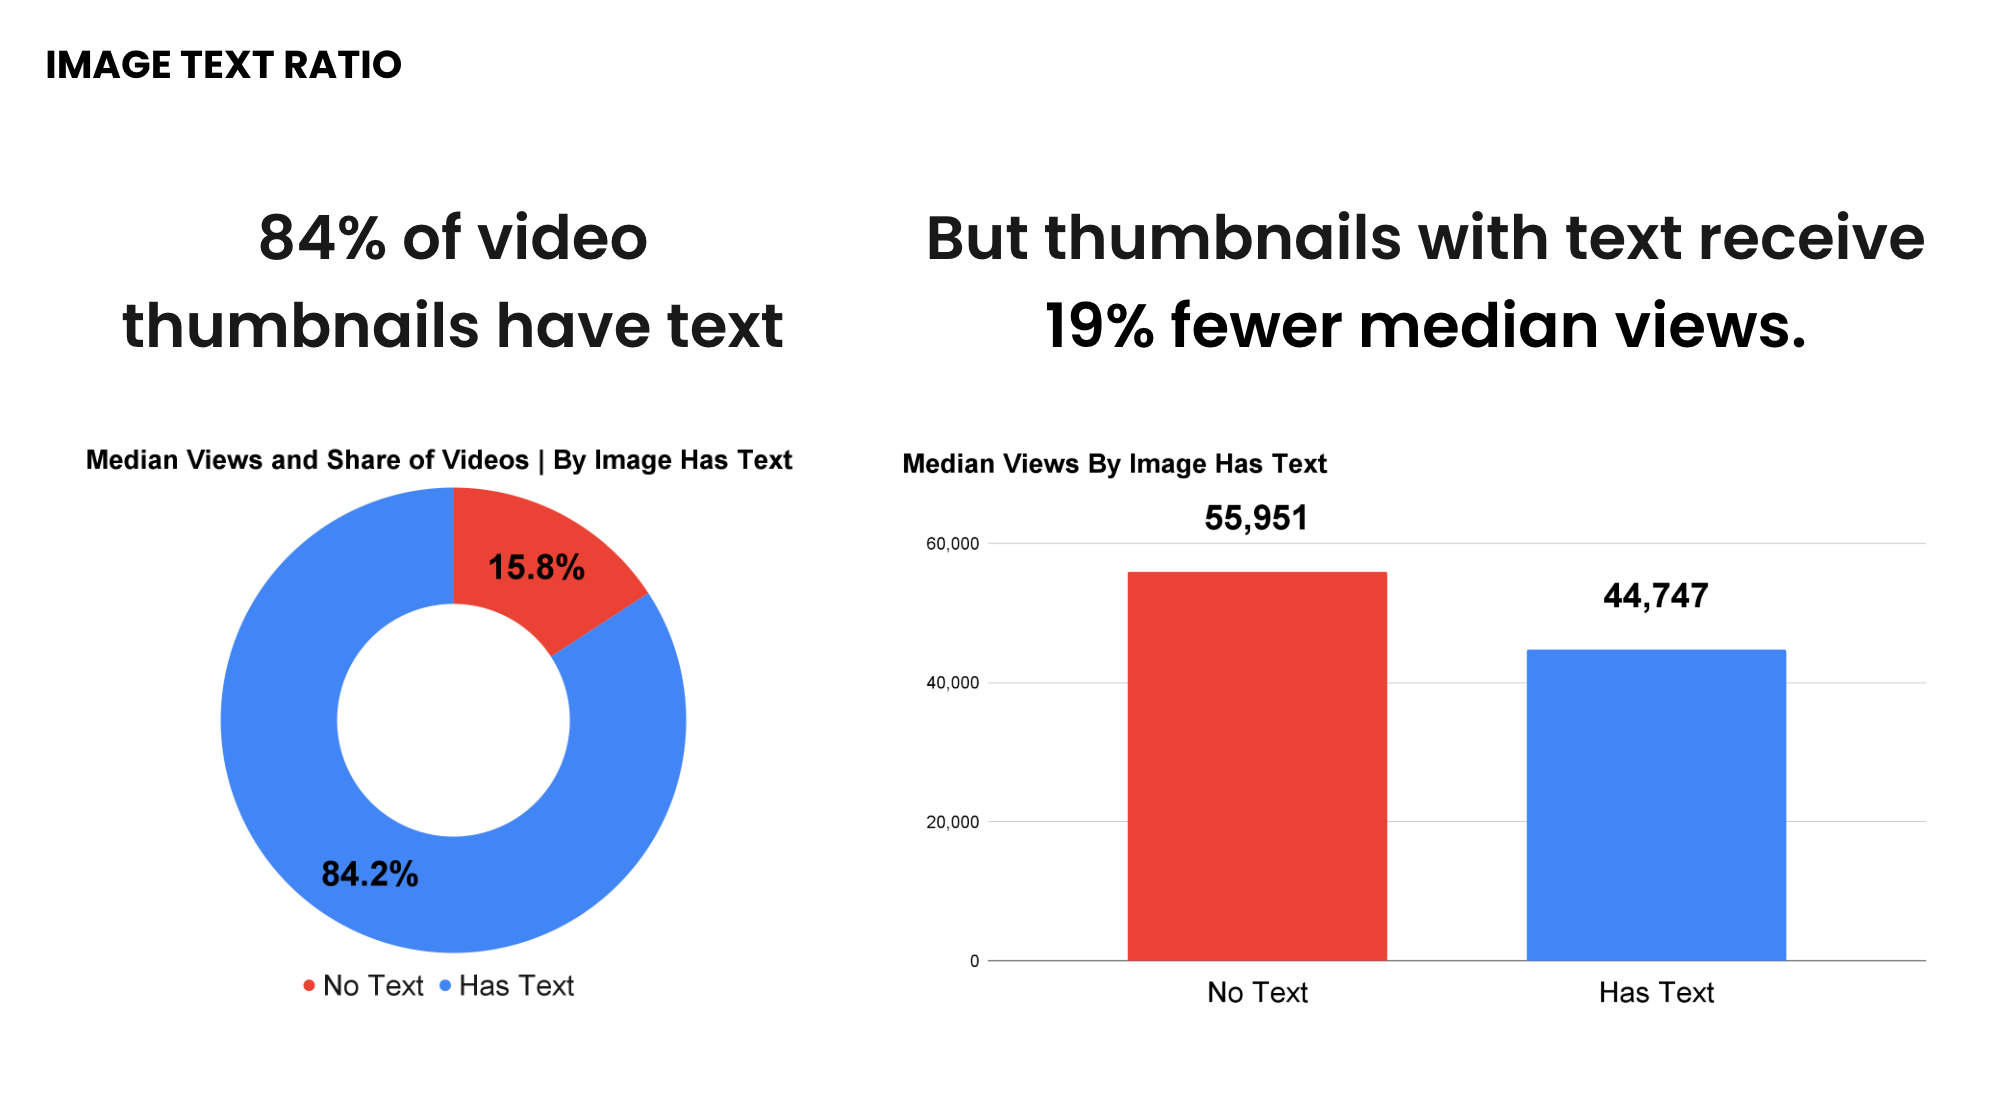
10) Thumbnail Text
- 84% of thumbnails include text
- Thumbnails with text receive ~19% fewer views
Best-performing setups:
- No text at all
or - Fewer than 10 characters
- Covering <7% of the image
Text should clarify emotion, not explain the video.
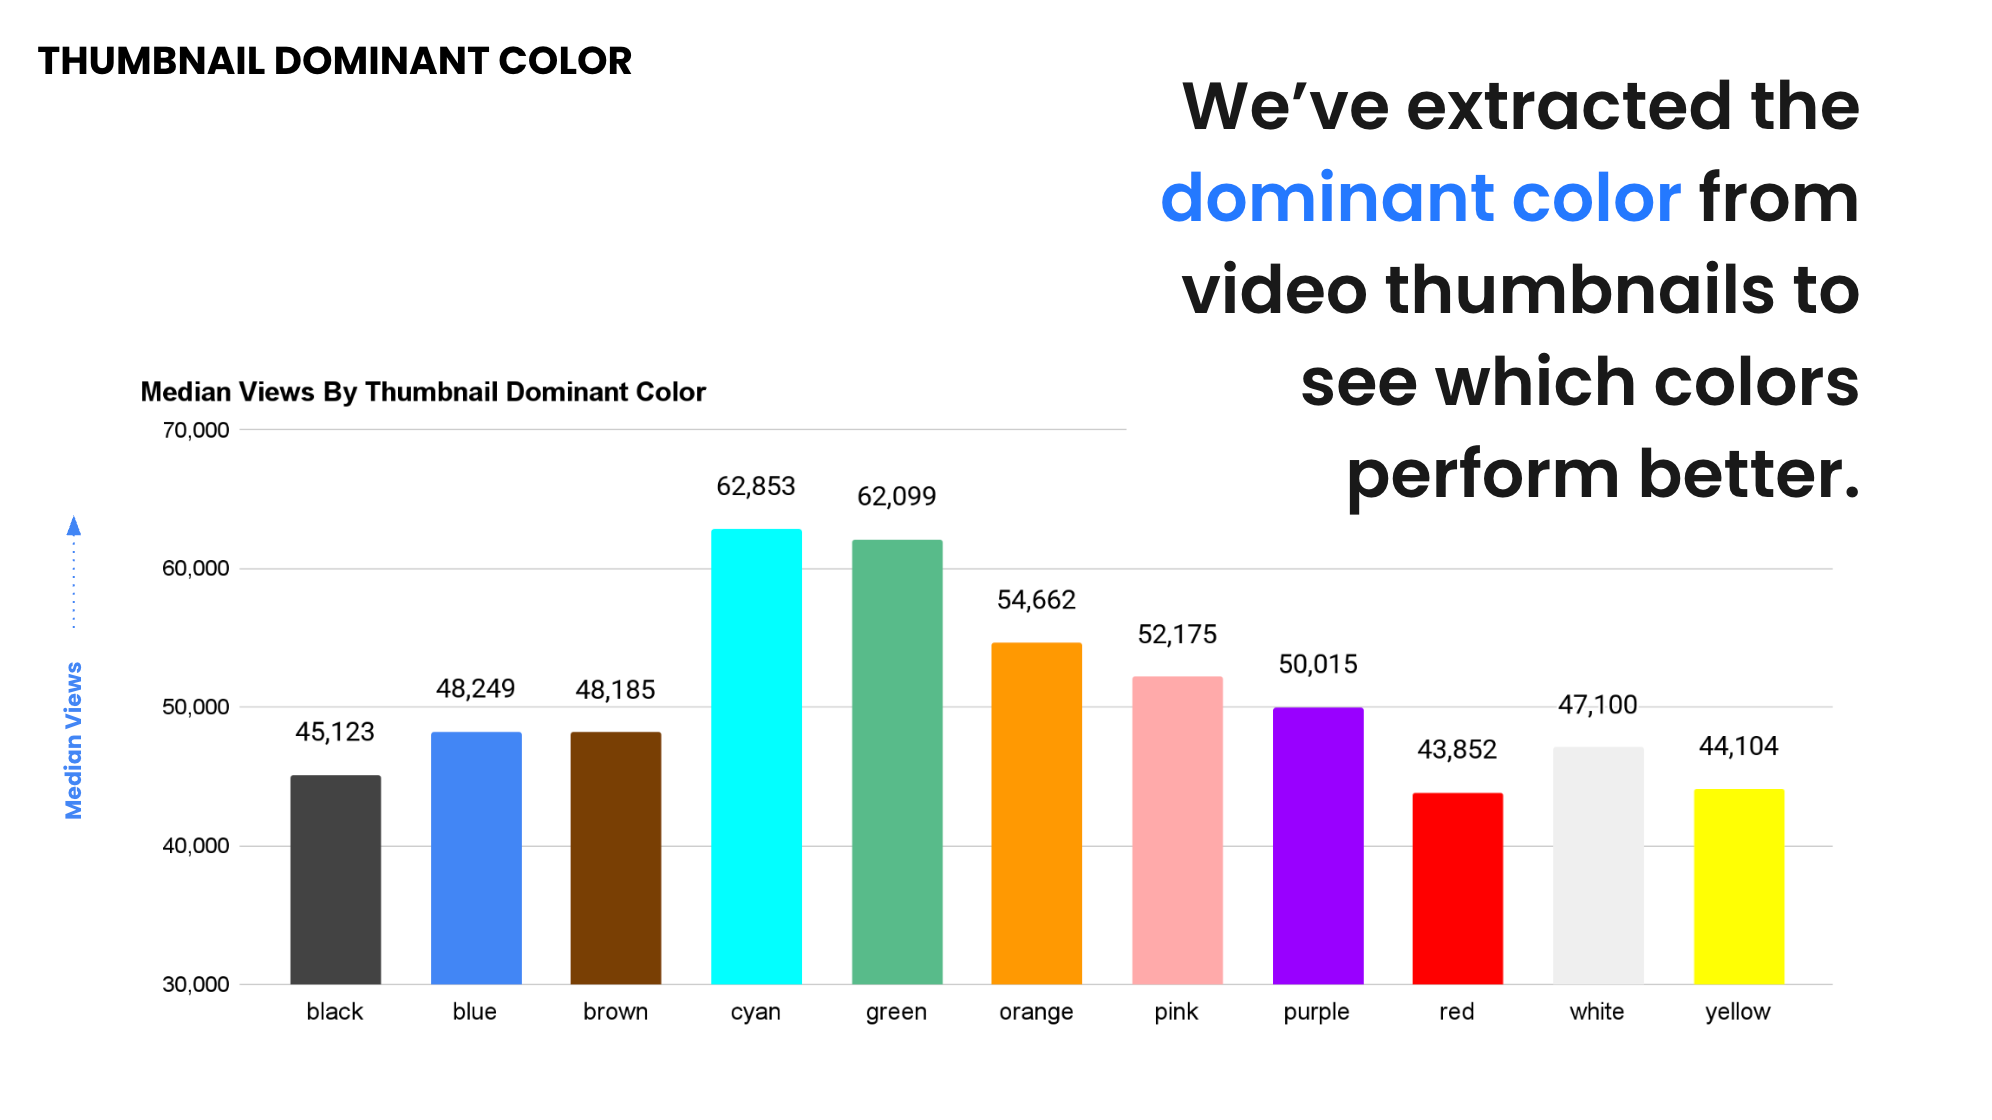
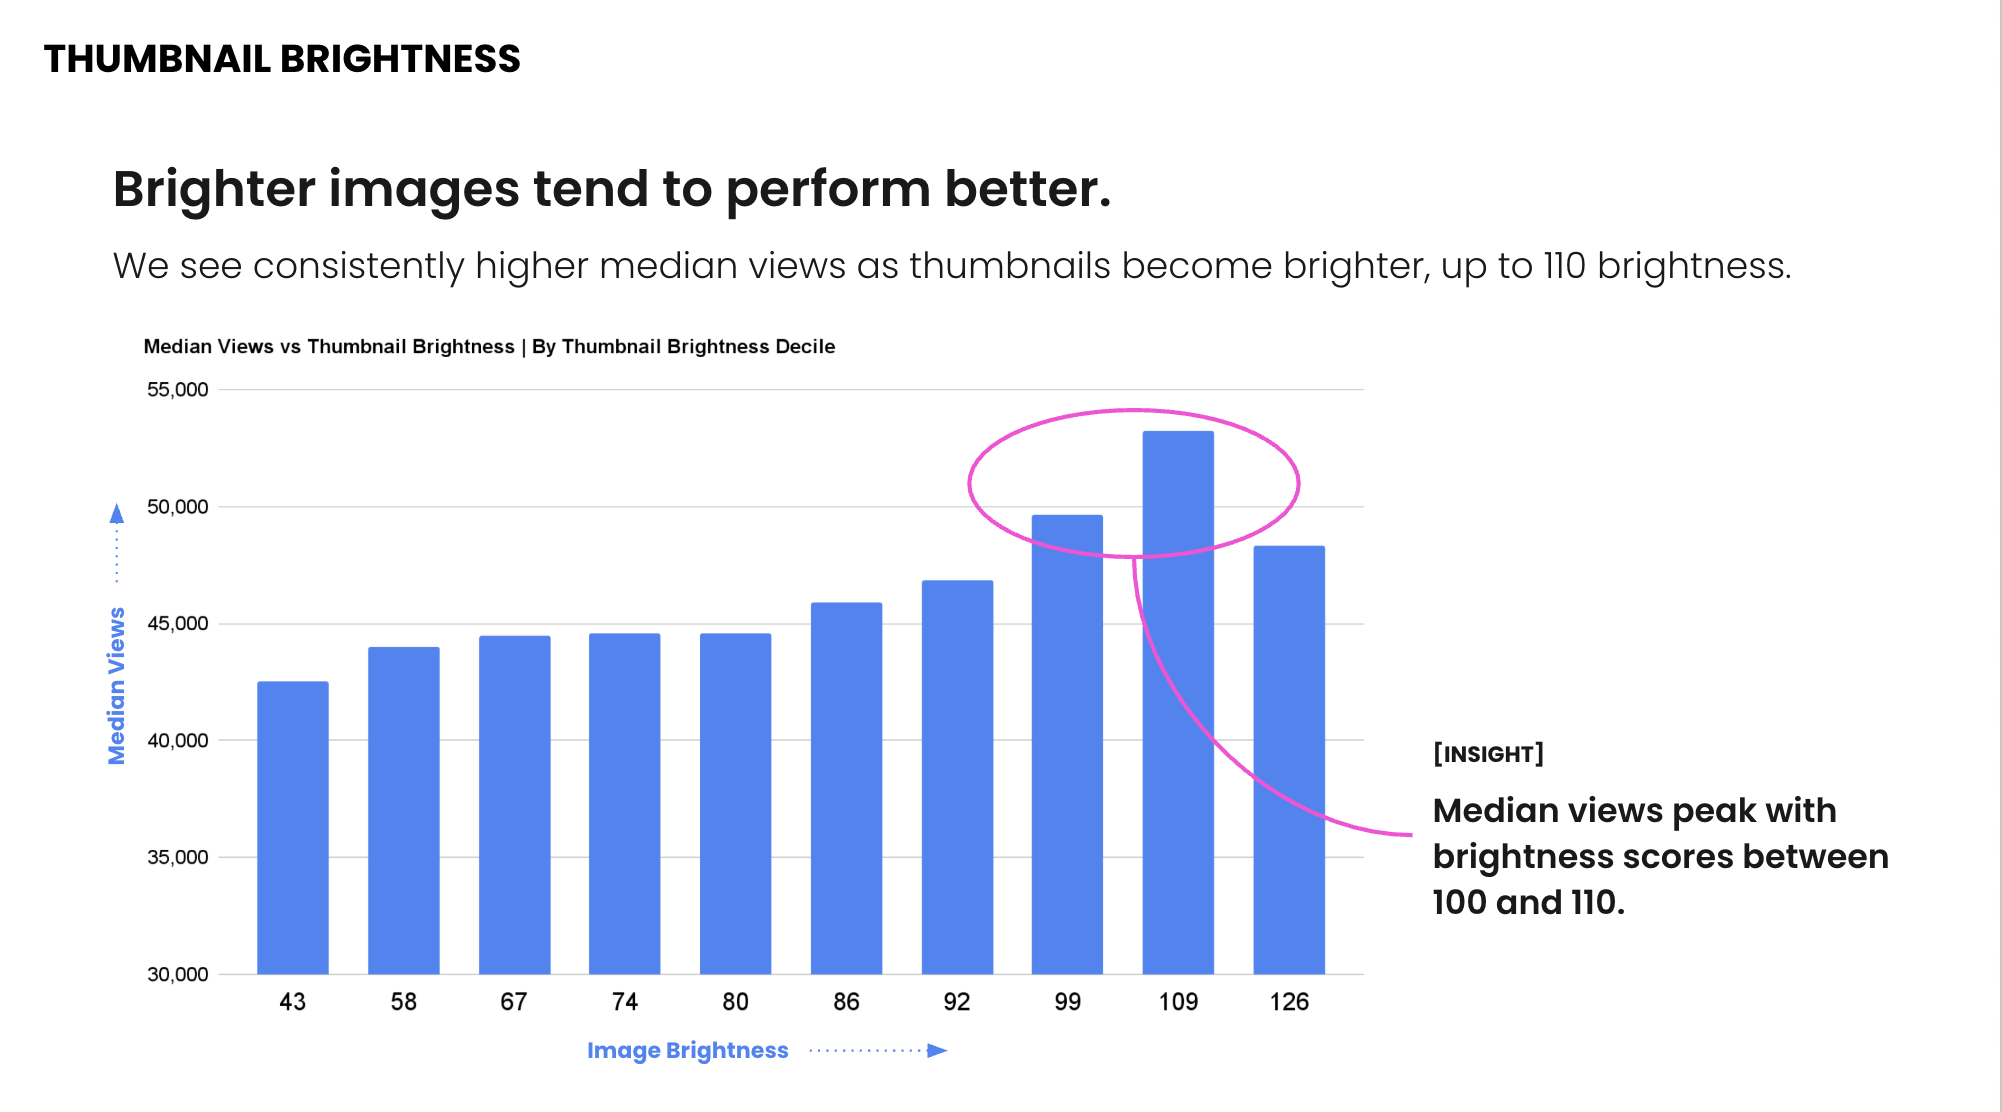
11) Thumbnail Color and Brightness
Best-performing dominant colors:
- Cyan
- Green
- Yellow / Orange
Cyan thumbnails earn ~36% more views than average.
Brightness matters:
- Performance increases as thumbnails get brighter
- Median views peak at brightness scores between 100–110
Dark thumbnails consistently underperform.
The Real Conclusion
Virality is not luck.
It’s the result of:
- Low cognitive friction
- Strong emotional framing
- Clear visual hierarchy
- Packaging designed for how humans actually decide
Most creators fail because they optimize for:
- Professionalism
- Cleverness
- What feels “high effort”
The winners optimize for:
- Instant comprehension
- Emotional pull
- Contrast and clarity
That’s the game now.
And creators who internalize this early pull away fast.